
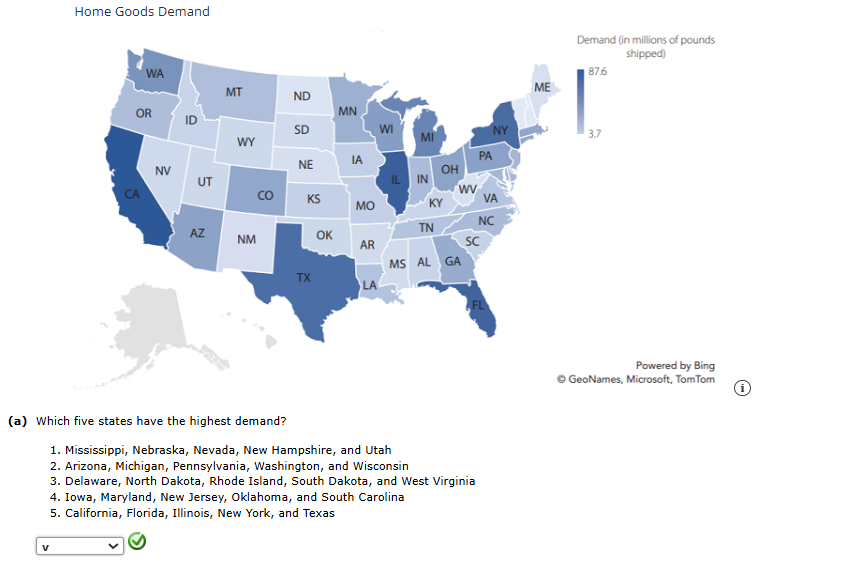
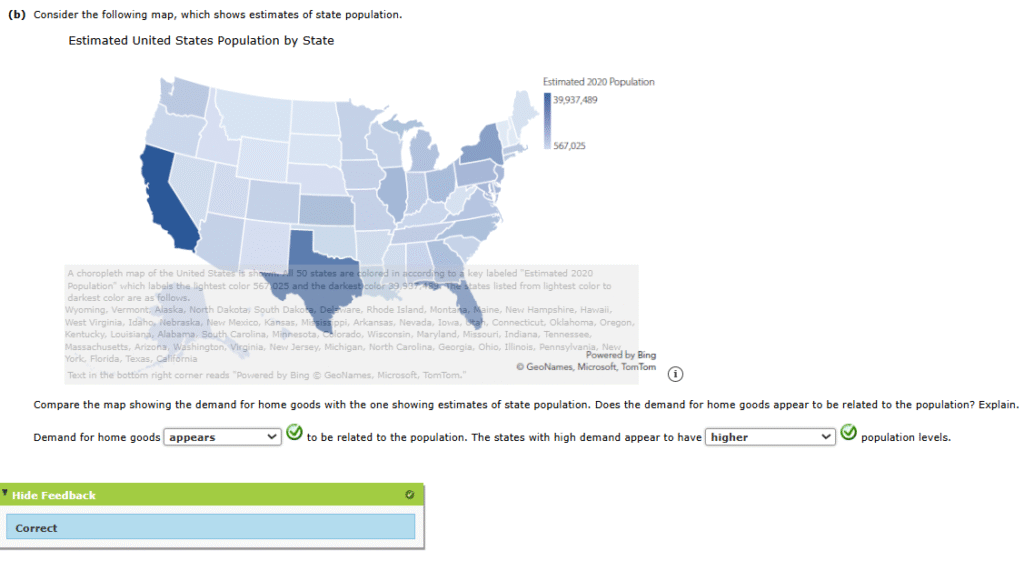
1.In supply chain planning, demand is often measured in pounds shipped. The following choropleth map shows the demand for home goods, measured in millions of pounds for each state in the United States.
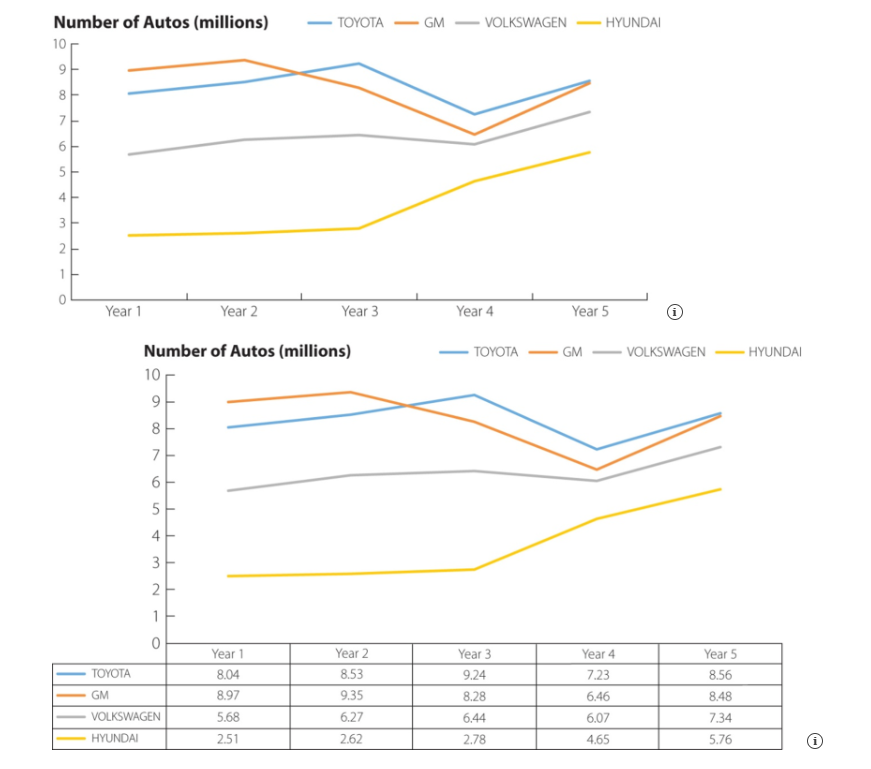
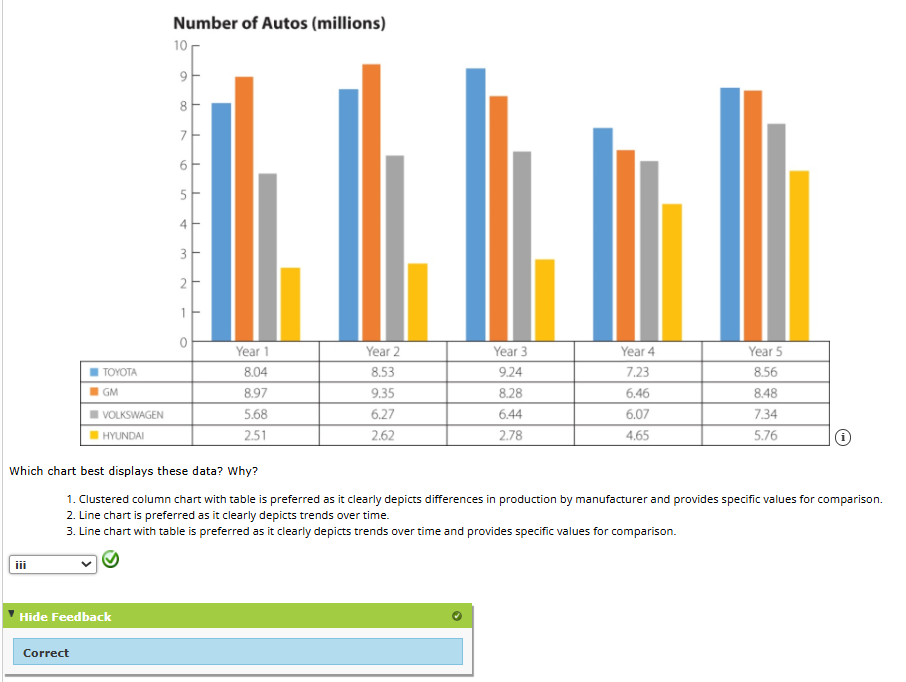
2. The International Organization of Motor Vehicle Manufacturers (officially known as the Organisation Internationale des Constructeurs d’Automobiles, OICA) provides data on worldwide vehicle production by manufacturer. The following three charts, a line chart, a line chart with a table, and a clustered column chart, show vehicle production numbers for four different manufacturers for five recent years.
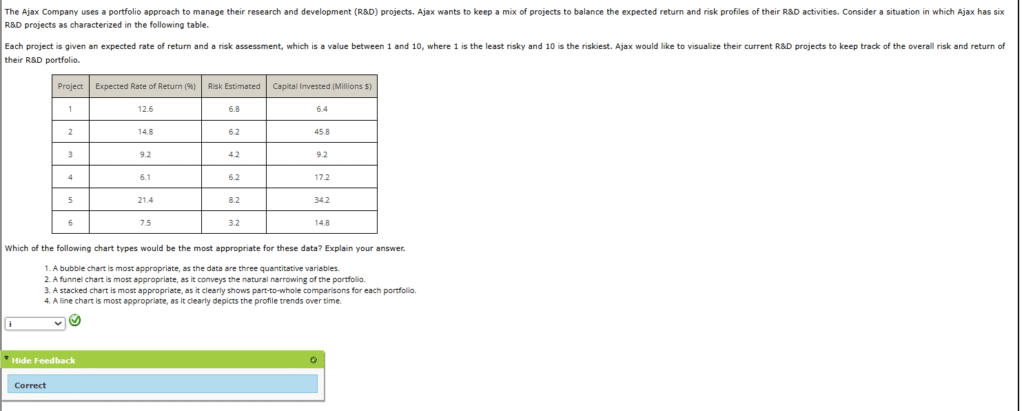
3. The Ajax Company uses a portfolio approach to manage their research and development (R&D) projects. Ajax wants to keep a mix of projects to balance the expected return and risk profiles of their R&D activities. Consider a situation in which Ajax has six R&D projects as characterized in the following table.
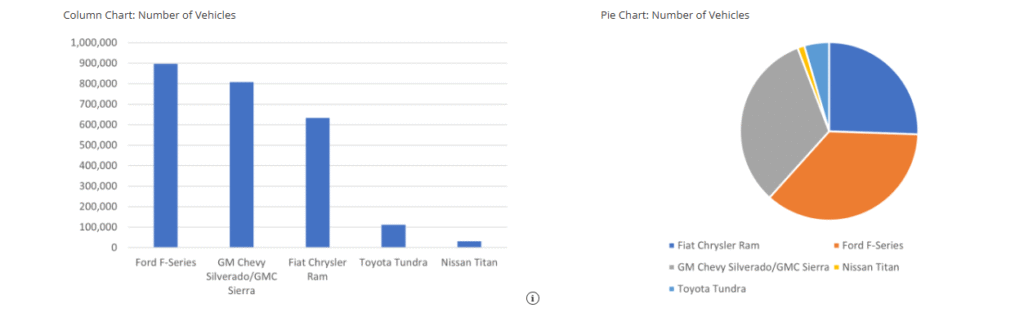
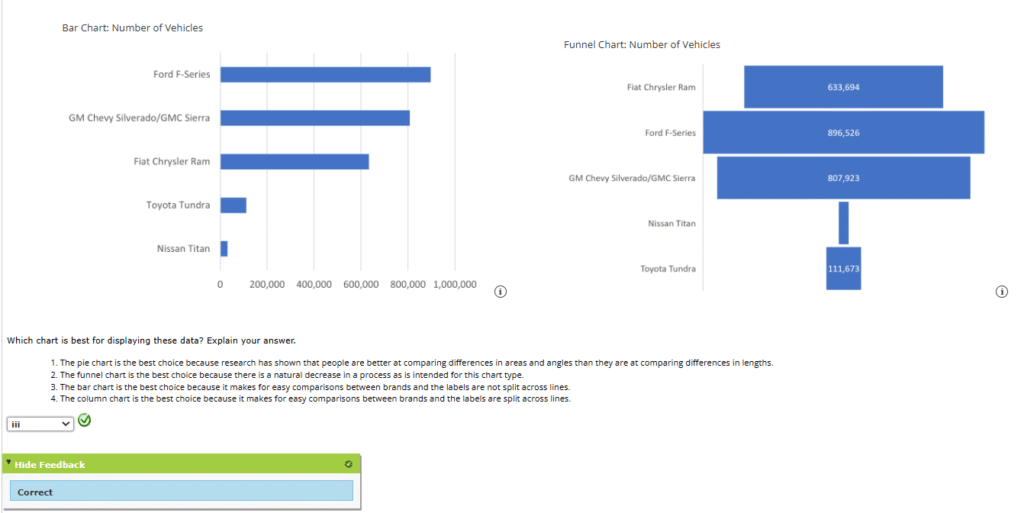
4. The following charts display the sales of pickup trucks in the United States by manufacturer for one year (source: The Wall Street Journal). You must choose one of these charts to edit as the final chart for your presentation to management.
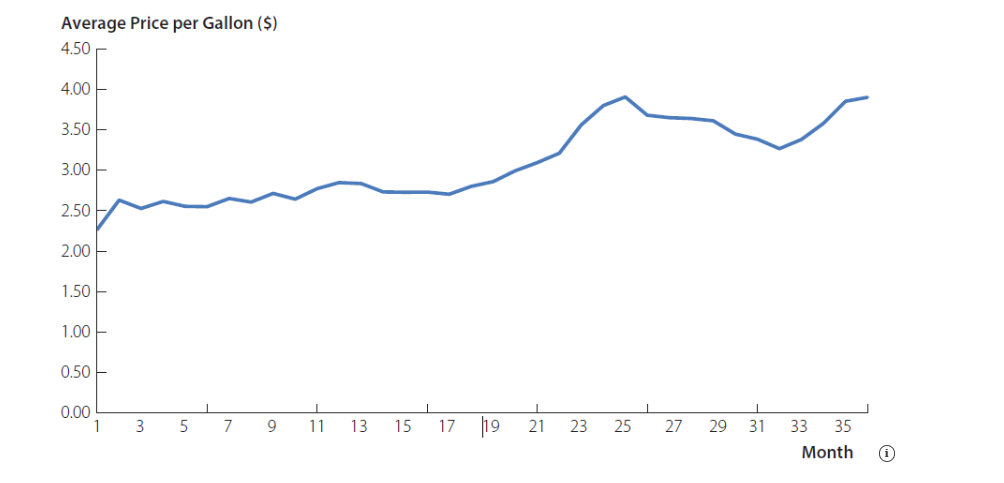
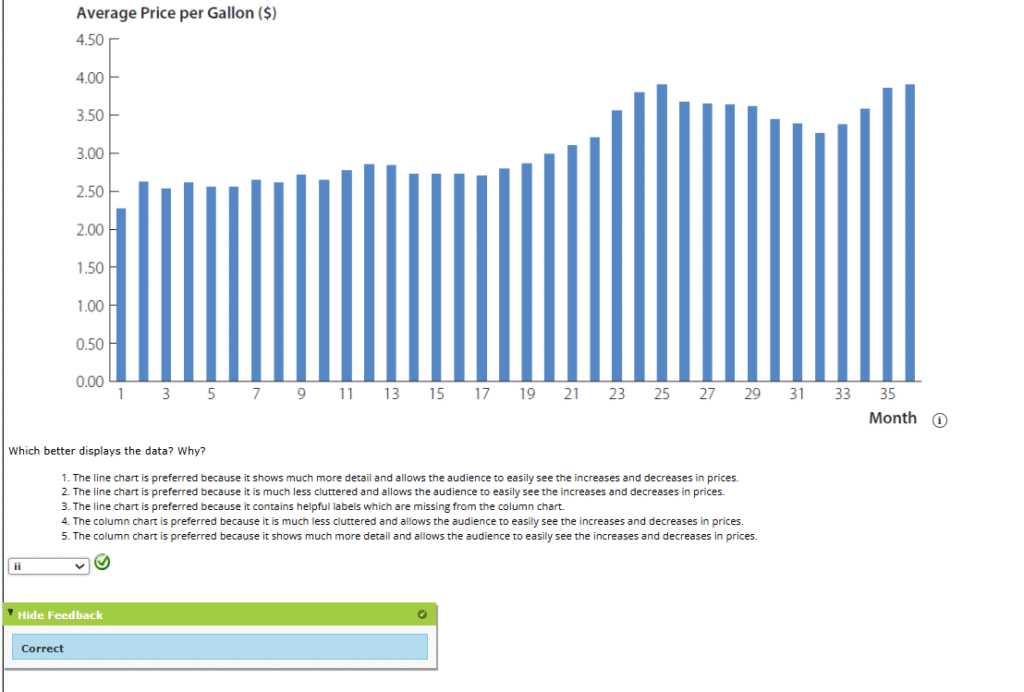
5. The following charts both show the average price (in dollars) per gallon of gasoline in the United States for 36 consecutive months. Consider the following charts. The first is a line chart and the second is a column chart.
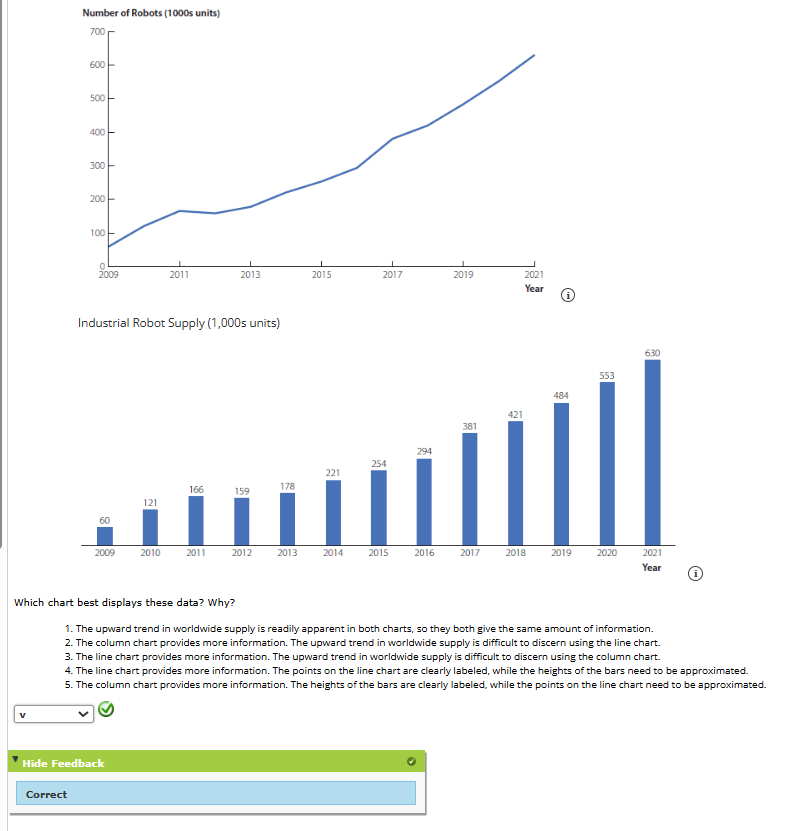
6. The International Federation of Robotics estimates the worldwide supply of industrial robots each year. The charts below show estimates of the worldwide supply of industrial robots for the years 2009–2021. The data are shown in two different charts below; the first is a line chart and the second is a column chart.
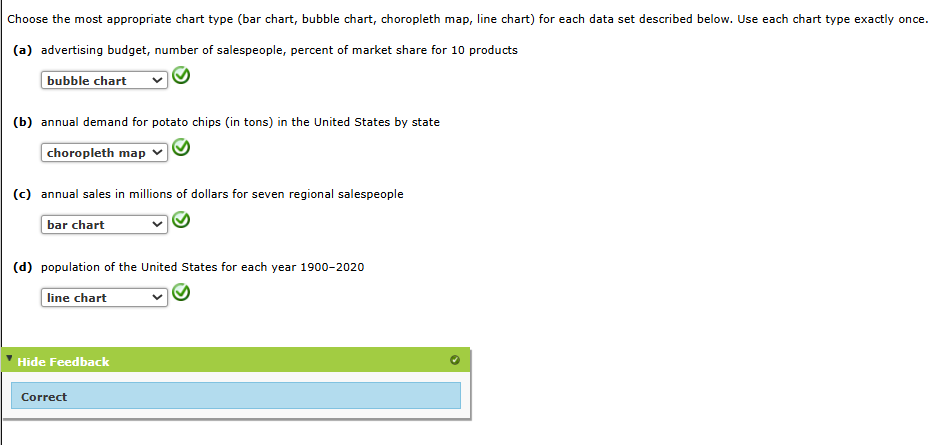
7. Choose the most appropriate chart type (bar chart, bubble chart, choropleth map, line chart) for each data set described below. Use each chart type exactly once.
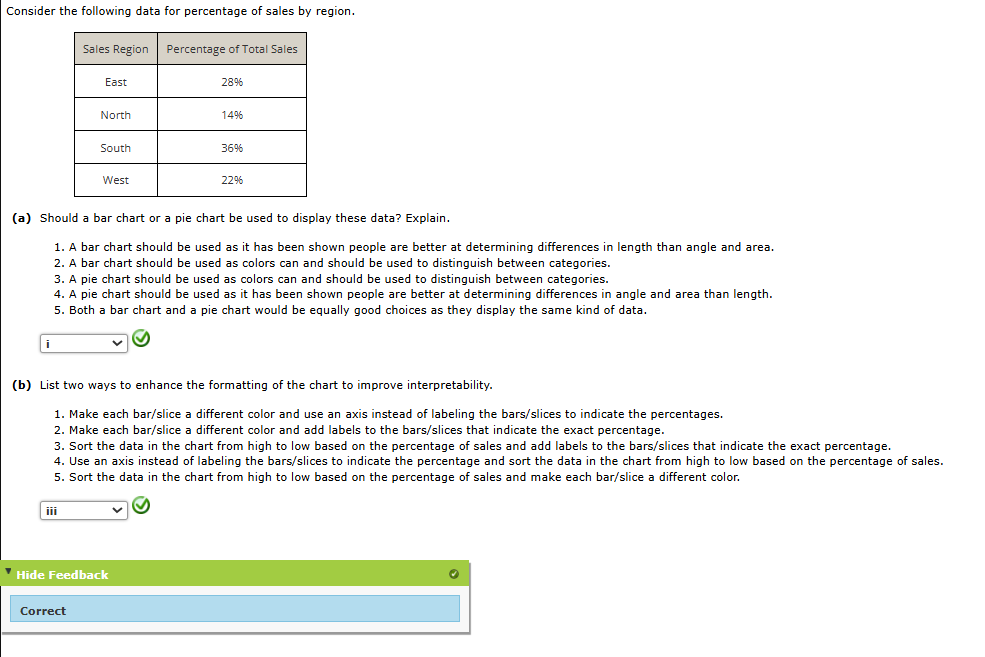
8. Consider the following data for percentage of sales by region.
9. Which of the following is the most appropriate chart for these data?

10. Suppose we have the following survey results regarding smartphone ownership by age in emerging countries.
| Age Category | Smartphone (%) | Other Cell Phone (%) | No Cell Phone (%) |
|---|---|---|---|
| 18–24 | 49 | 46 | 5 |
| 25–34 | 58 | 35 | 7 |
| 35–44 | 44 | 45 | 11 |
| 45–54 | 28 | 58 | 14 |
| 55–64 | 22 | 59 | 19 |
| 65+ | 11 | 45 | 44 |


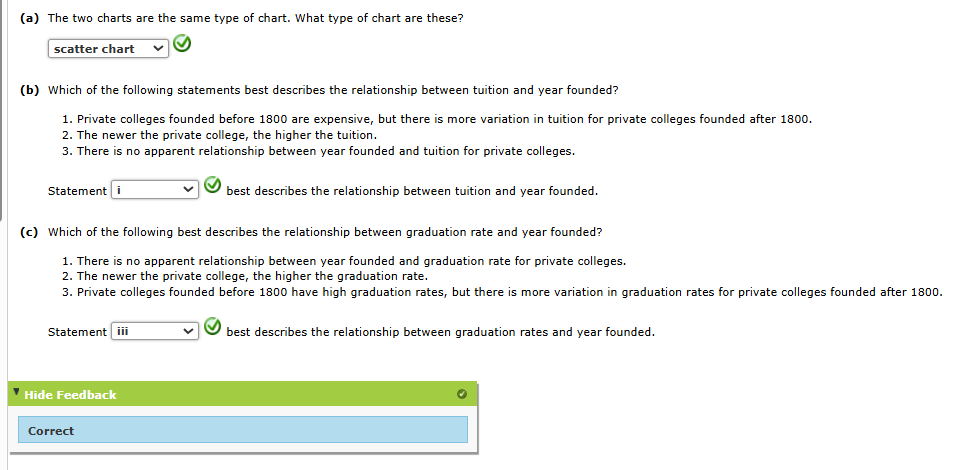
11. For a sample of 103 private colleges, data have been collected on year founded, tuition and fees (not including room and board) for the year these data were collected, and the percentage of undergraduates who obtained their degree within six years (source: The World Almanac). The following two charts plot tuition versus year founded, and graduation rate versus year founded, respectively.


12. In addition to the high, low, and closing price, an open-high-low-close stock chart uses the opening price per share to give an indication of the net change in the stock price from open to close on a given day. This is designated by a box inside the high-low range. The range of the box is determined by the opening and closing price per share. A black box indicates a loss and a white box indicates a gain for that day. The length of the box indicates the magnitude of the loss or gain in share price. The following chart is an open-high-low-close chart for a two-week period for a soft drink company. Note that May 16 and May 17 are a Saturday and a Sunday and are nontrading days.

13. The three charts below show the price of a general admission ticket to Walt Disney World for the years 2000–2020. The first is a bar chart, the second is an area chart, and the third is a scatter chart.


14. You are conducting an analysis of the makeup of the departments in your firm. Your goal is to compare the departments’ mix of academic backgrounds. You have defined the following categories for academic background: Business, Engineering, and Other. You have the percentage of employees in each category for each of the four departments as shown in the table below.

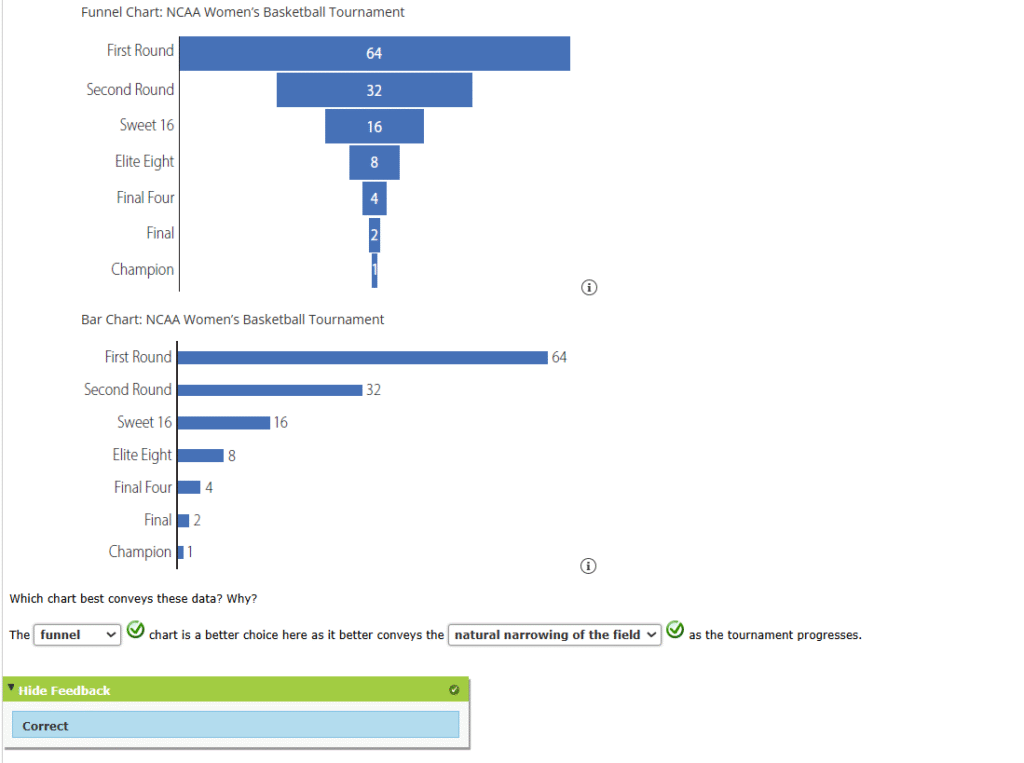
15. Since 1994, the NCAA Division I women’s basketball tournament has had a starting field of 64 teams, and over the course of 63 single-elimination games, a champion is determined. The following two charts (a funnel chart and a bar chart) show how the tournament progresses from the starting field of 64 teams.
16. The following stock chart shows stock price performance for a soft drink company over a two-week period. Note that May 16 and May 17 are a Saturday and a Sunday and are nontrading days.
