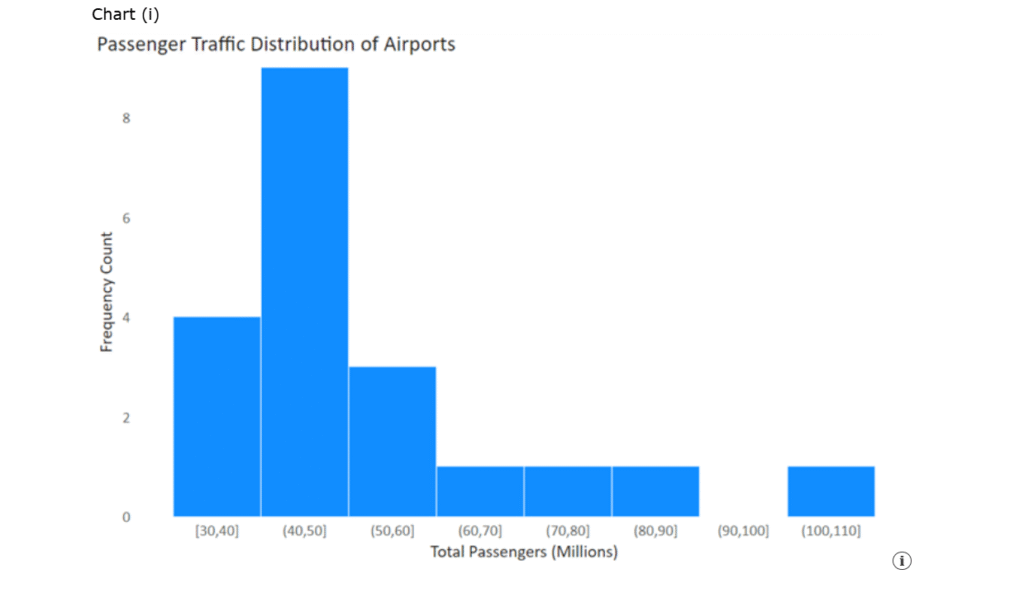
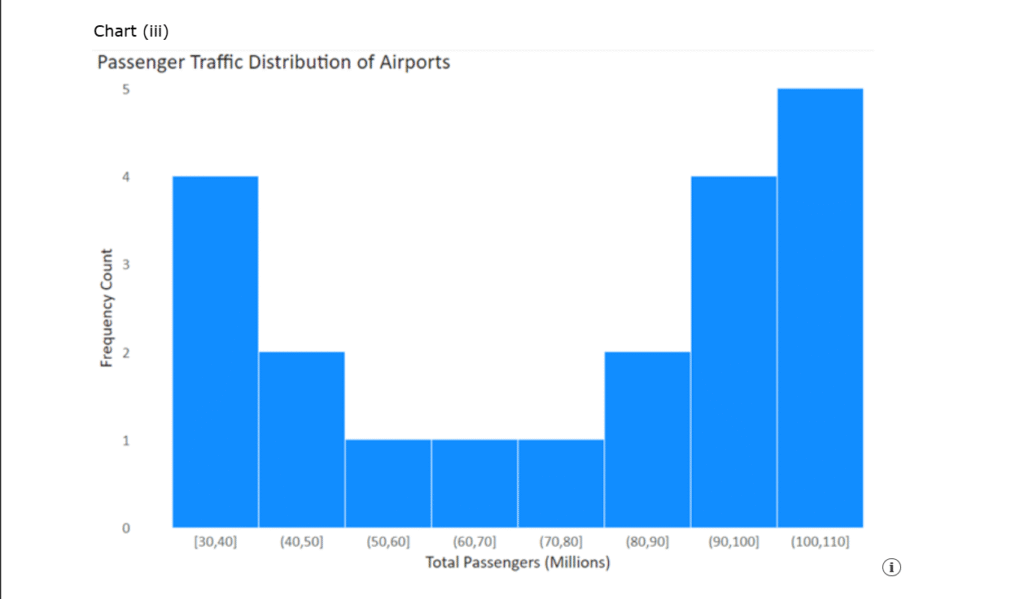
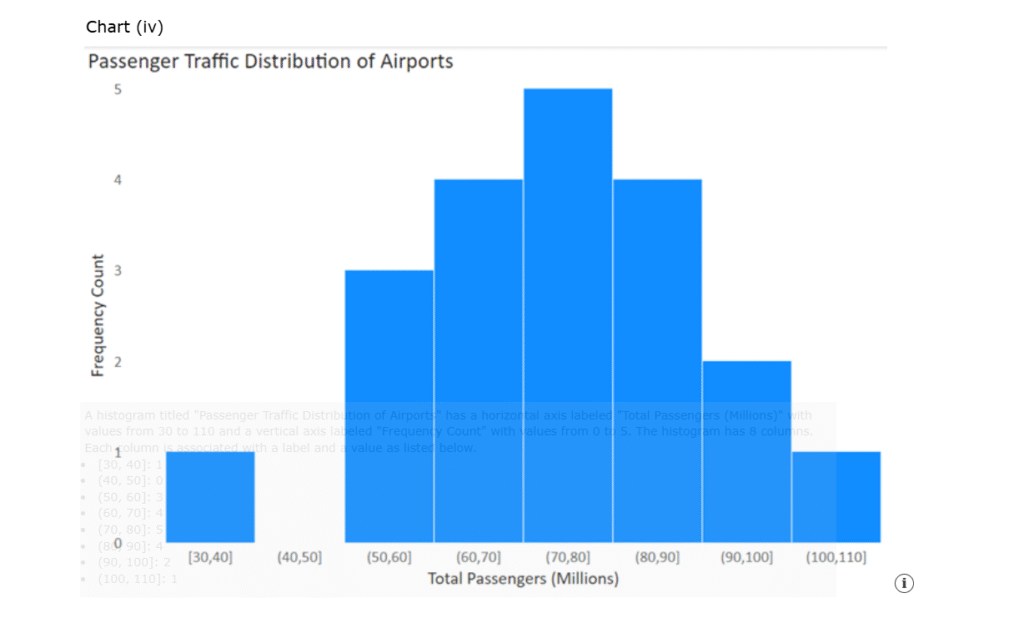
1.Based on the total passenger traffic, the airports in the file airports_table are among the busiest in North America. (a) Construct a histogram of the frequency counts using a bin width of 10 with the first bin starting at a value of 30 million. Hint: Use a stacked column chart and the Table worksheet. The space between the columns can be reduced as follows. 1. Click anywhere on the chart. 2. In the Visualizations pane, click the Format visual button. 3. In the Visual tab, expand the Columns menu, then expand the Layout menu. 4. Under Space between categories, change the setting to 1%.
2. Companies considering purchasing ads during televised XFL football games are interested in the viewership of games as a way of estimating the exposure their ads get. The file xfl_stacked contains a sample of viewership numbers for XFL games televised on Friday and Saturday nights, respectively. (a)
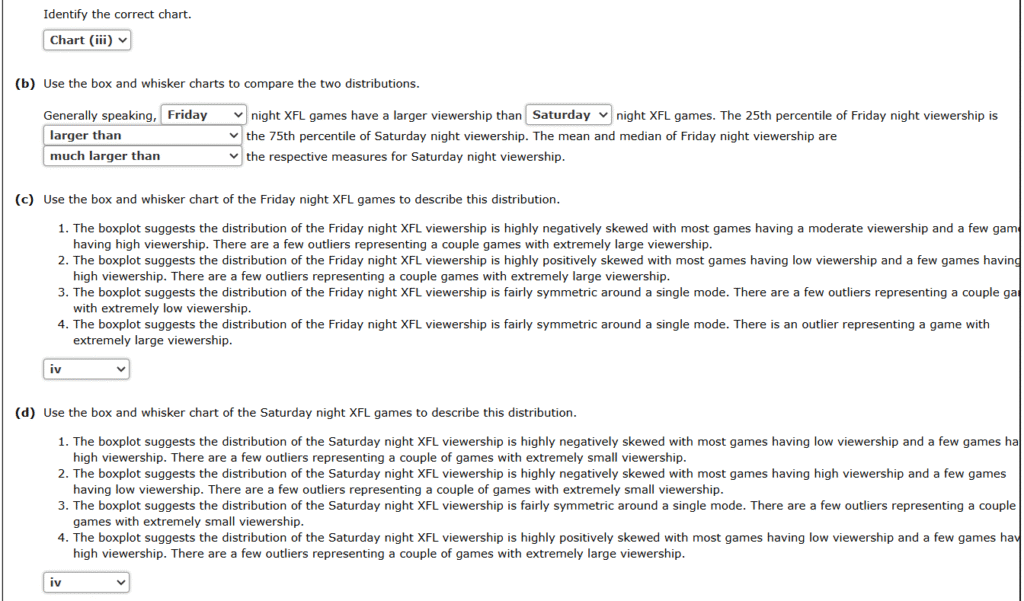
Construct box and whisker charts on the same chart that compare the viewership distribution of Friday night XFL games to the viewership distribution of Saturday night XFL games.
Chart (i)The box and whisker charts are titled “Viewership of Televised XFL Games” and have a vertical axis labeled “Viewers (1,000s)” with values from 0 to 7,000. The box and whisker charts are also vertical.The box and whisker chart labeled “Friday Night” occurs first. The bottom whisker is at approximately 110, the bottom edge of the box is at approximately 1,640, the line inside the box is at approximately 2,320, the top edge of the box is at approximately 3,030, and the top whisker is at approximately 5,030. There is 1 visible outlier located at approximately 5,610. A square is placed at approximately 2,360.The box and whisker chart labeled “Saturday Night” occurs next. The bottom whisker is at approximately 1,130, the bottom edge of the box is at approximately 1,800, the line inside the box is at approximately 2,240, the top edge of the box is at approximately 3,530, and the top whisker is at approximately 5,910. There is 1 visible outlier located at approximately 6,400. A square is placed at approximately 2,690.Chart (ii)The box and whisker charts are titled “Viewership of Televised XFL Games” and have a vertical axis labeled “Viewers (1,000s)” with values from 0 to 7,000. The box and whisker charts are also vertical.The box and whisker chart labeled “Friday Night” occurs first. The bottom whisker is at approximately 280, the bottom edge of the box is at approximately 2,350, the line inside the box is at approximately 3,030, the top edge of the box is at approximately 3,850, and the top whisker is at approximately 5,840. There is 1 visible outlier located at approximately 6,140. A square is placed at approximately 3,110.The box and whisker chart labeled “Saturday Night” occurs next. The bottom whisker is at approximately 0, the bottom edge of the box is at approximately 380, the line inside the box is at approximately 700, the top edge of the box is at approximately 2,020, and the top whisker is at approximately 4,470. There are 2 visible outliers located at approximately 4,570 and approximately 4,670. A square is placed at approximately 1,200.Chart (iii)The box and whisker charts are titled “Viewership of Televised XFL Games” and have a vertical axis labeled “Viewers (1,000s)” with values from 0 to 7,000. The box and whisker charts are also vertical.The box and whisker chart labeled “Friday Night” occurs first. The bottom whisker is at approximately 1,130, the bottom edge of the box is at approximately 1,800, the line inside the box is at approximately 2,240, the top edge of the box is at approximately 3,530, and the top whisker is at approximately 5,910. There is 1 visible outlier located at approximately 6,400. A square is placed at approximately 2,690.The box and whisker chart labeled “Saturday Night” occurs next. The bottom whisker is at approximately 110, the bottom edge of the box is at approximately 1,640, the line inside the box is at approximately 2,320, the top edge of the box is at approximately 3,030, and the top whisker is at approximately 5,030. There is 1 visible outlier located at approximately 5,610. A square is placed at approximately 2,360.Chart (iv)The box and whisker charts are titled “Viewership of Televised XFL Games” and have a vertical axis labeled “Viewers (1,000s)” with values from 0 to 7,000. The box and whisker charts are also vertical.The box and whisker chart labeled “Friday Night” occurs first. The bottom whisker is at approximately 0, the bottom edge of the box is at approximately 380, the line inside the box is at approximately 700, the top edge of the box is at approximately 2,020, and the top whisker is at approximately 4,470. There are 2 visible outliers located at approximately 4,570 and approximately 4,670. A square is placed at approximately 1,200.The box and whisker chart labeled “Saturday Night” occurs next. The bottom whisker is at approximately 280, the bottom edge of the box is at approximately 2,350, the line inside the box is at approximately 3,030, the top edge of the box is at approximately 3,850, and the top whisker is at approximately 5,840. There is 1 visible outlier located at approximately 6,140. A square is placed at approximately 3,110.
3. In a recent report, the top five most-visited English-language websites were google.com (GOOG), facebook.com (FB), youtube.com (YT), yahoo.com (YAH), and wikipedia.com (WIKI). The file websites contains a sample of the favorite website for 50 Internet users. (a)
Using a column chart, visualize the frequency distribution for these data.
Chart (i)A column chart titled “Visit Distribution for Websites” has 5 bars. Each bar is associated with a label and a value as listed below.YT: 14FB: 13GOOG: 9WIKI: 7YAH: 7Chart (ii)A column chart titled “Visit Distribution for Websites” has 5 bars. Each bar is associated with a label and a value as listed below.FB: 14WIKI: 13YT: 9GOOG: 7YAH: 7Chart (iii)A column chart titled “Visit Distribution for Websites” has 5 bars. Each bar is associated with a label and a value as listed below.GOOG: 14YAH: 13WIKI: 9FB: 7YT: 7Chart (iv)A column chart titled “Visit Distribution for Websites” has 5 bars. Each bar is associated with a label and a value as listed below.YT: 14GOOG: 13YAH: 9FB: 7WIKI: 7