
1. What is the arithmetic mean (rounded to two decimal places) in the following table on the variable score?
A.

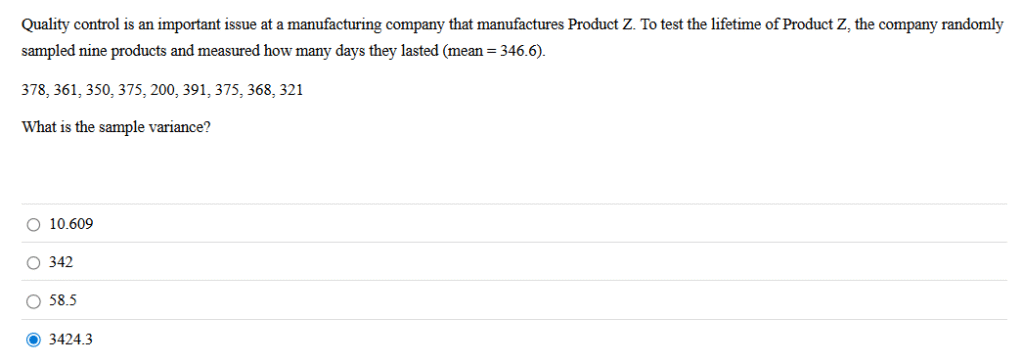
2. Quality control is an important issue at a manufacturing company that manufactures Product Z. To test the lifetime of Product Z, the company randomly sampled nine products and measured how many days they lasted (mean = 346.6).
A.
3. A frequency distribution can be created for __________.
A.

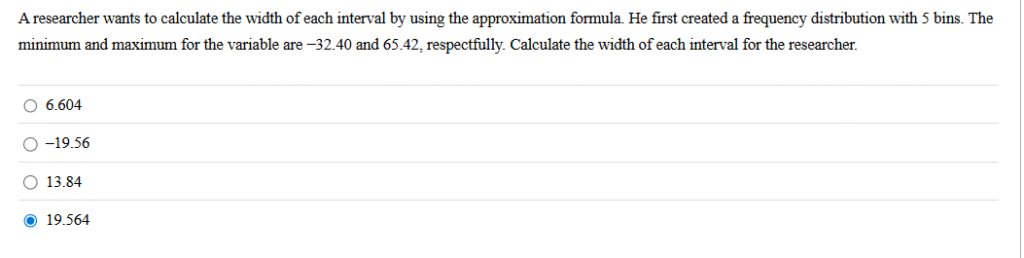
4. A researcher wants to calculate the width of each interval by using the approximation formula. He first created a frequency distribution with 5 bins. The minimum and maximum for the variable are −32.40 and 65.42, respectfully. Calculate the width of each interval for the researcher.
A.
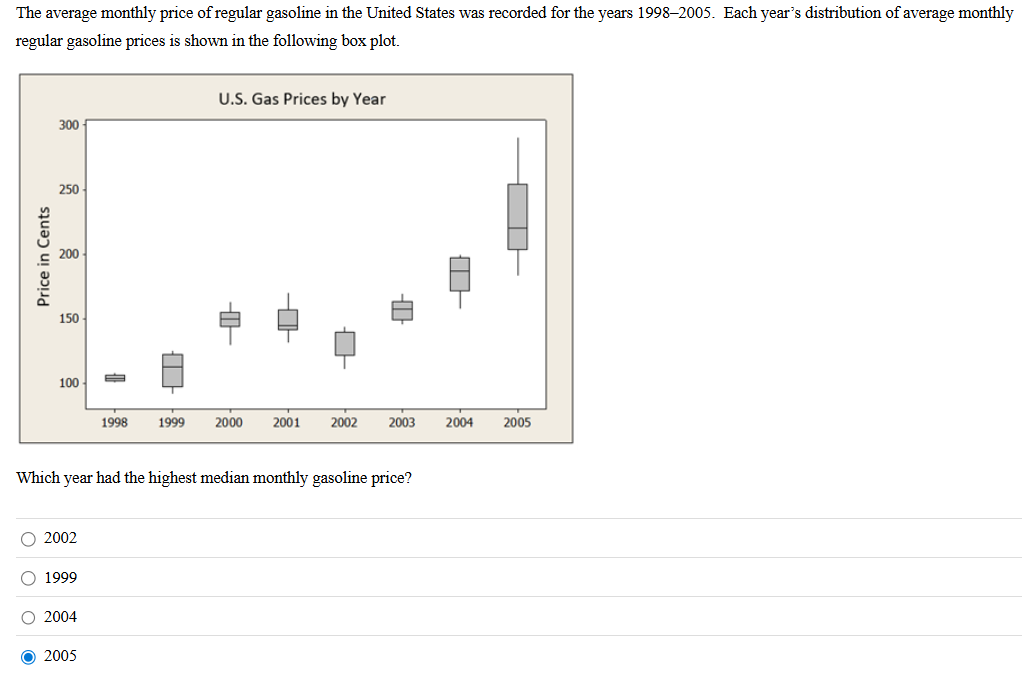
5. The average monthly price of regular gasoline in the United States was recorded for the years 1998–2005. Each year’s distribution of average monthly regular gasoline prices is shown in the following box plot.
A.

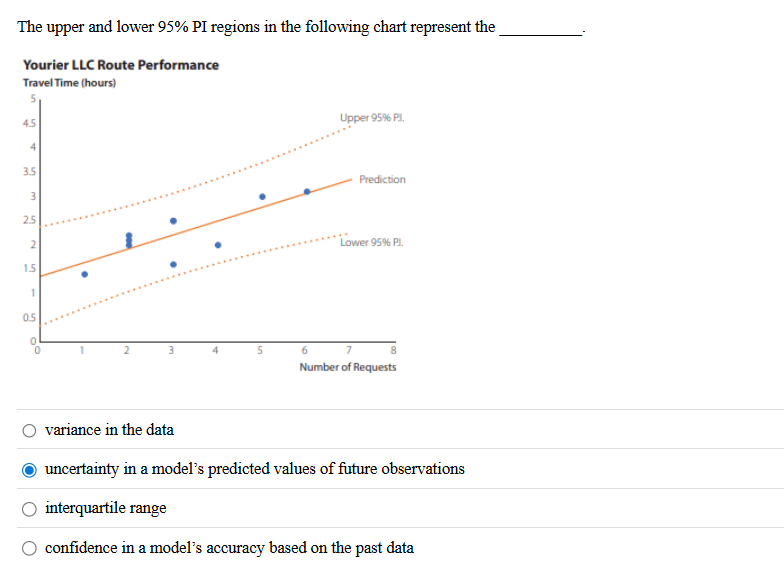
6. The upper and lower 95% PI regions in the following chart represent the __________.
A.
7. The process of collecting sample data to make estimates of, or draw conclusions about, one or more characteristics of a population is called __________.
A.
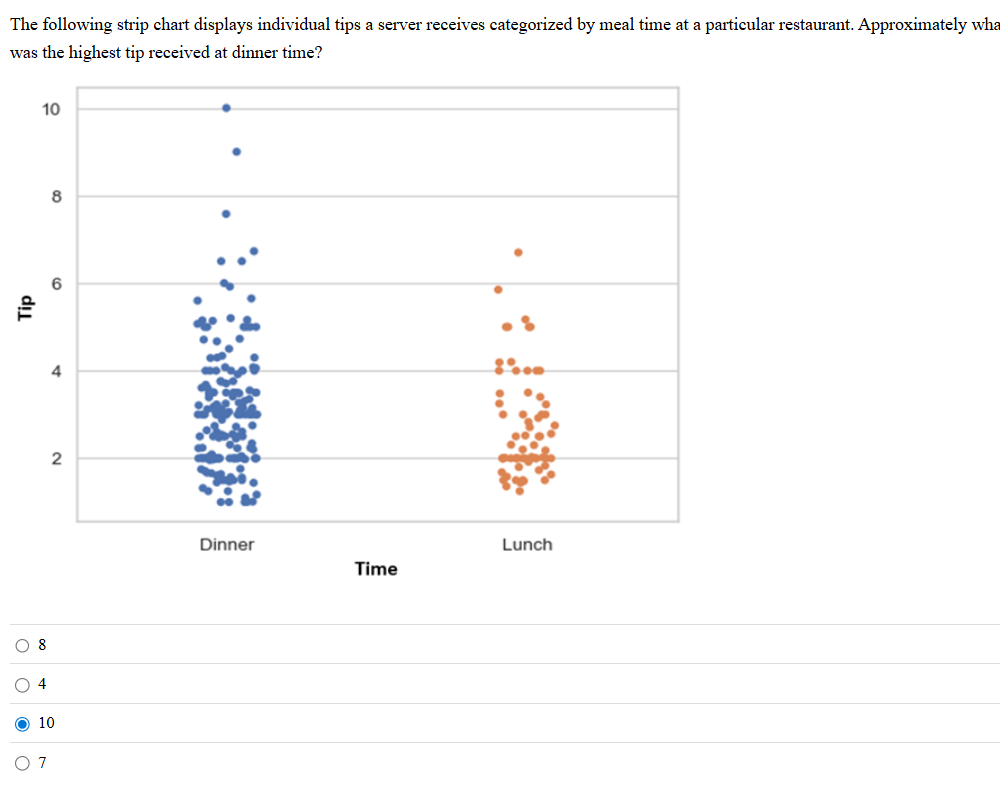
8. The following strip chart displays individual tips a server receives categorized by meal time at a particular restaurant. Approximately what was the highest tip received at dinner time?
A.
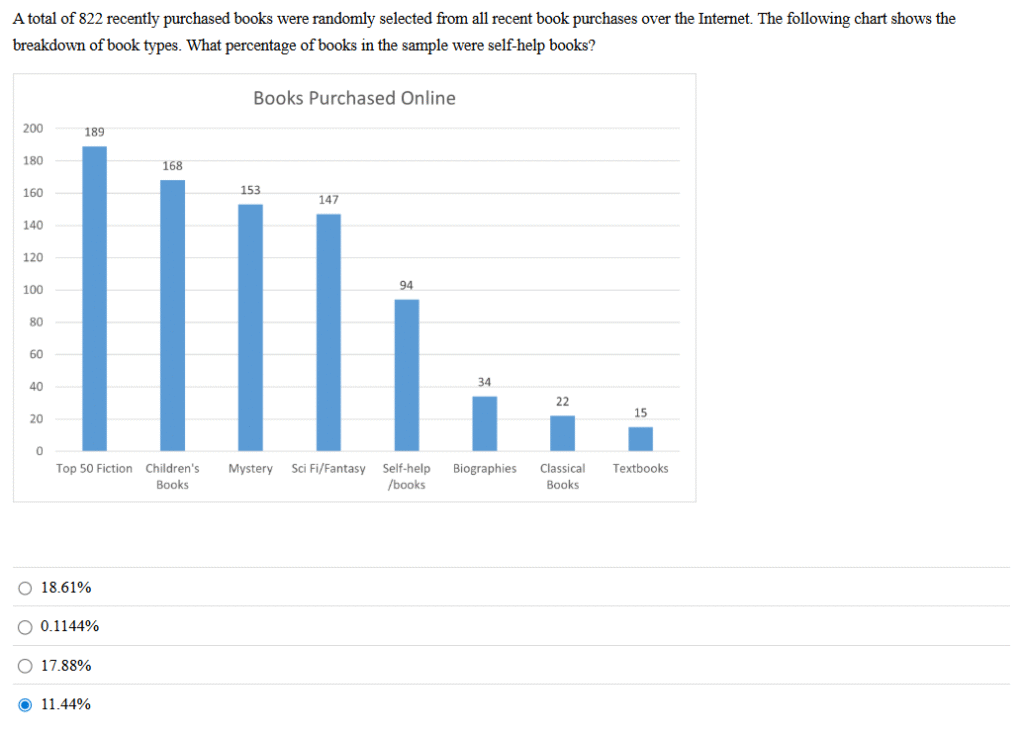
9. A total of 822 recently purchased books were randomly selected from all recent book purchases over the Internet. The following chart shows the breakdown of book types. What percentage of books in the sample were self-help books?
A.
10. What does the red arrow indicate in the following box plot displaying the distribution of exam scores?
A.

11. Using the following table, what is the percent frequency of a blue car being observed?
A. 19.9%
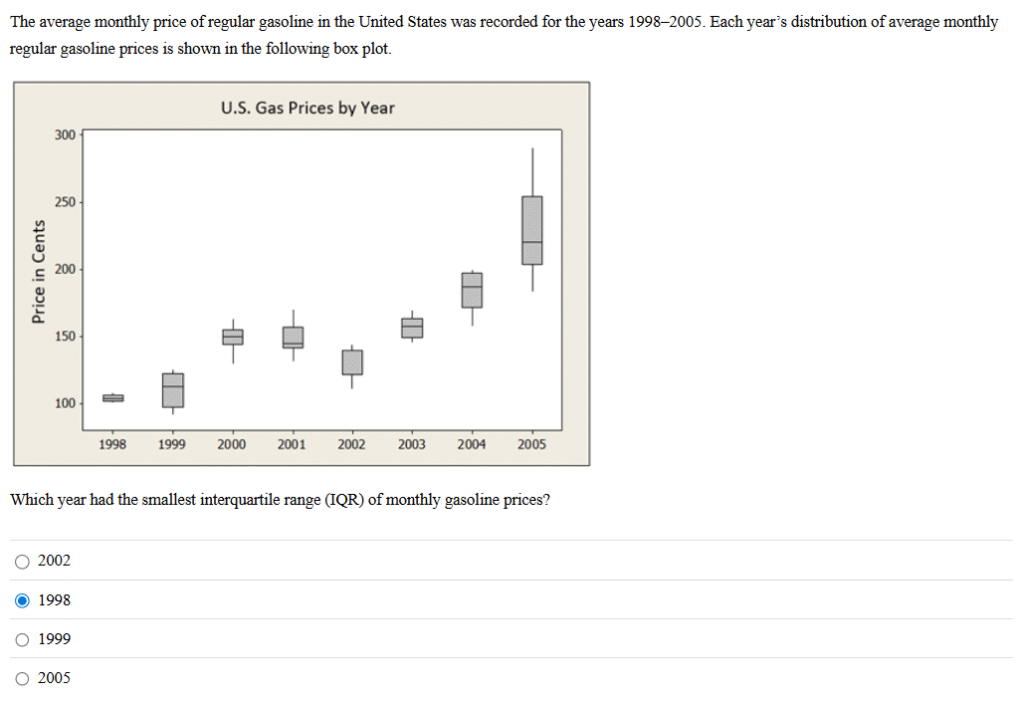
12. The average monthly price of regular gasoline in the United States was recorded for the years 1998–2005. Each year’s distribution of average monthly regular gasoline prices is shown in the following box plot.
A.
13. The frequency of each class with categorical data is displayed by a _____________, while the frequency of each class with quantitative data is displayed by a __________.
A. bar chart; histogram
14. The average monthly price of regular gasoline in the United States was recorded for the years 1998–2005. Each year’s distribution of average monthly regular gasoline prices is shown in the following box plot.
A.
15. Which of the following divides quantitative measurements into classes and graphs the frequency, relative frequency, or percent frequency for each class?
A. Histogram
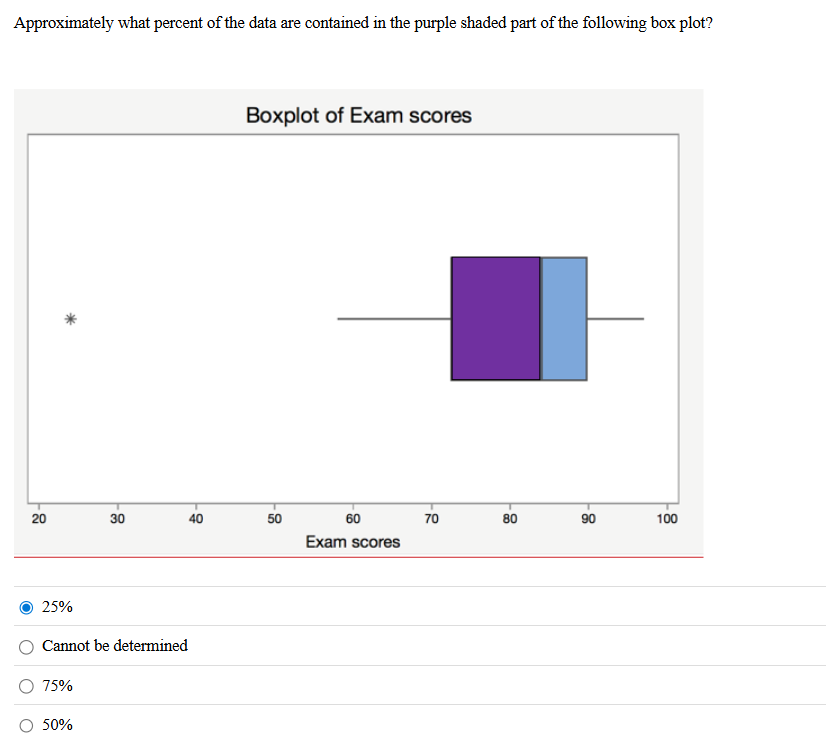
16. Approximately what percent of the data are contained in the purple shaded part of the following box plot?
A.
17. Based on the following strip chart, which month has the lowest temperature?
A.

18. The difference between the minimum and maximum observation of a variable is called the __________.
A. range
19. What is indicated by the red arrow in the following box plot displaying the distribution of exam scores?
A.

20. What type of relationship is represented in the following scatter chart of two numeric variables?
A.

21. In Power BI, what is the purpose of using the “Upper box color” and “Lower box color” options when formatting box and whisker charts?
A. To differentiate between the upper and lower portions of the box
22. In Power BI, what is the purpose of using the “Mean shape” and “Mean width” options when formatting a box and whisker chart?
A. To control the appearance of the mean value marker in the chart
23. In Power BI, what is the purpose of using the “Box and Whisker by MAQ Software” custom visual instead of the default box and whisker chart?
A. To display the mean value in addition to the median and quartiles
24. In Power BI, what is the purpose of using the “Whisker type” option when formatting box and whisker charts?
A. To determine the length of the whiskers based on the interquartile range (IQR)
25. In the Power Query Editor, what is the purpose of selecting “Use First Row as Headers”?
A. To ensure that the first row is treated as column headers