
Question 1
Delta Airlines quotes a flight time of 2 hours, 5 minutes for its flights from Cincinnati to Tampa. Suppose we believe that actual flight times are uniformly distributed between 2 hours and 2 hours, 20 minutes.

a. Which of the following graphs accurately represents the probability density function for flight time in minutes?
Select – Graph #1
b. What is the probability that the flight will be no more than 5 minutes late (to 2 decimals)?
c. What is the probability that the flight will be more than 10 minutes late (to 2 decimals)?
d. What is the expected flight time, in minutes?
130
Question 2
The Information Systems Audit and Control Association surveyed office workers to learn about the anticipated usage of office computers for personal holiday shopping (USA Today, November 11, 2009). Assume that the number of hours a worker spends doing holiday shopping on an office computer follows an exponential distribution.
a. The study reported that there is a .53 probability that a worker uses an office computer for holiday shopping 5 hours or less. Is the mean time spent using an office computer for holiday shopping closest to 5.8, 6.2, 6.6, or 7 hours?
Select – 6.6
b. Using the mean time from part (a), what is the probability that a worker uses an office computer for holiday shopping more than 10 hours (to 4 decimals)?
0.2198
c. What is the probability that a worker uses an office computer for holiday shopping between 4 and 8 hours (to 4 decimals)?
0.2479
question 3
The mean cost of domestic airfares in the United States rose to an all-time high of $380 per ticket. Airfares were based on the total ticket value, which consisted of the price charged by the airlines plus any additional taxes and fees. Assume domestic airfares are normally distributed with a standard deviation of $100. Use Table 1 in Appendix B.
a. What is the probability that a domestic airfare is $540 or more (to 4 decimals)?
0.0548
b. What is the probability that a domestic airfare is $255 or less (to 4 decimals)?
0.9394
c. What if the probability that a domestic airfare is between $310 and $470 (to 4 decimals)?
0.5739
d. What is the cost for the 4% highest domestic airfares? (rounded to nearest dollar)
$ 555 or – Select – more
question 4
Wendy’s restaurant has been recognized for having the fastest average service time among fast food restaurants. In a benchmark study, Wendy’s average service time of 2.2 minutes was less than those of Burger King, Chick-fil-A, Krystal, McDonald’s, Taco Bell, and Taco John’s (QSR Magazine website, December 2014). Assume that the service time for Wendy’s has an exponential distribution.
a. What is the probability that a service time is less than or equal to one minute (to 4 decimals)?
0.3653
b. What is the probability that a service time is between 30 seconds and one minute (to 4 decimals)?
0.1620
c. Suppose a manager of a Wendy’s is considering instituting a policy such that if the time it takes to serve you exceeds five minutes, your food is free. What is the probability that you will get your food for free (to 4 decimals)?
0.1030
Comment.
The input in the box below will not be graded, but may be reviewed and considered by your instructor.
The chance of getting the food for free is of 10.33% because the P-value is more than the significance value that is 0.05 and it is not an usual value.
Question 5
A CBS News/New York Times survey found that 97% of Americans believe that texting while driving should be outlawed (CBS News website, January 5, 2015).
a. For a sample of 10 Americans, what is the probability that at least 8 say that they believe texting while driving should be outlawed? Use the binomial distribution probability function to answer this question (to 4 decimals).
0.9972
b. For a sample of 100 Americans, what is the probability that at least 95 say that they believe texting while driving should be outlawed? Use the normal approximation of the binomial distribution to answer this question (to 4 decimals). Use “Continuity correction factor” method. Use Table 1 in Appendix B.
0.9292
c. As the number of trials in a binomial distribution application becomes large, what is the advantage of using the normal approximation of the binomial distribution to compute probabilities?
Select-Simplifies calculation of probabilities
d. When the number of trials for a binominal distribution application becomes large, would developers of statistical software packages prefer to use the binomial distribution probability function shown in Section 5.5 or the normal approximation of the binomial distribution discussed in Section 6.3?
Select-Normal approximation
Explain.
The input in the box below will not be graded, but may be reviewed and considered by your instructor.
When the number of attempts for binomial distribution application becomes large, would statistical software packet developer are referred to use normal approximation of the binomial distribution becuase calculating with binomial distribution probability can be tiresome to calculations.
Question 6
Suppose we are interested in bidding on a piece of land and we know one other bidder is interested. The seller announced that the highest bid in excess of $9,500 will be accepted. Assume that the competitor’s bid x is a random variable that is uniformly distributed between $9,500 and $15,500.
a. Suppose you bid $12,000. What is the probability that your bid will be accepted (to 2 decimals)?
b. Suppose you bid $14,000. What is the probability that your bid will be accepted (to 2 decimals)?
c. What amount should you bid to maximize the probability that you get the property (in dollars)?
d. Suppose that you know someone is willing to pay you $16,000 for the property. You are considering bidding the amount shown in part (c) but a friend suggests you bid $12,750. If your objective is to maximize the expected profit, what is your bid?
Select Stay with your bid in part (c); it maximizes expected profit
Question 7
A random variable is normally distributed with a mean of = 50 and a standard deviation of = 5. Use Table 1 in Appendix B.
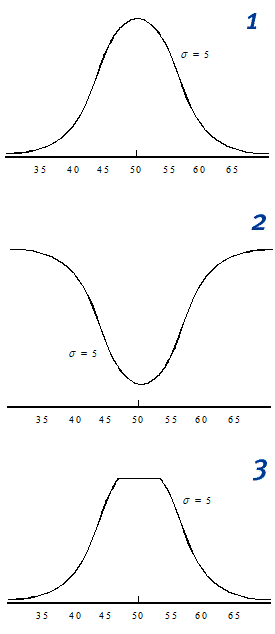
a. Which of the following graphs accurately represents the probability density function?
Select – Graph #1
b. What is the probability the random variable will assume a value between 45 and 55 (to 4 decimals)?
0.9545
c. What is the probability the random variable will assume a value between 40 and 60 (to 4 decimals)?
Question 8
Given that z is a standard normal random variable, compute the following probabilities (to 4 decimals). Use Table 1 in Appendix B.
a. P(z -1.0)
b. P(z -1.0)
c. P(z -1.5)
d. P(z -2.5)
e. P(-3 < z 0)
Other Links:
See other websites for quiz:
Check on QUIZLETCheck on CHEGG