
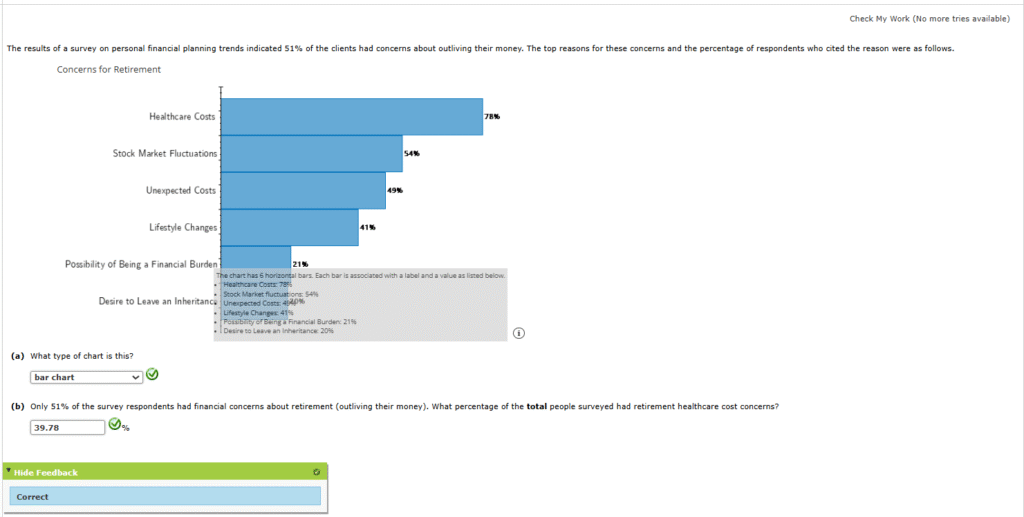
1. The results of a survey on personal financial planning trends indicated 51% of the clients had concerns about outliving their money. The top reasons for these concerns and the percentage of respondents who cited the reason were as follows.
2. An analytics professional is asked to plan the shipment of a product for the next quarter. They employ the following process.

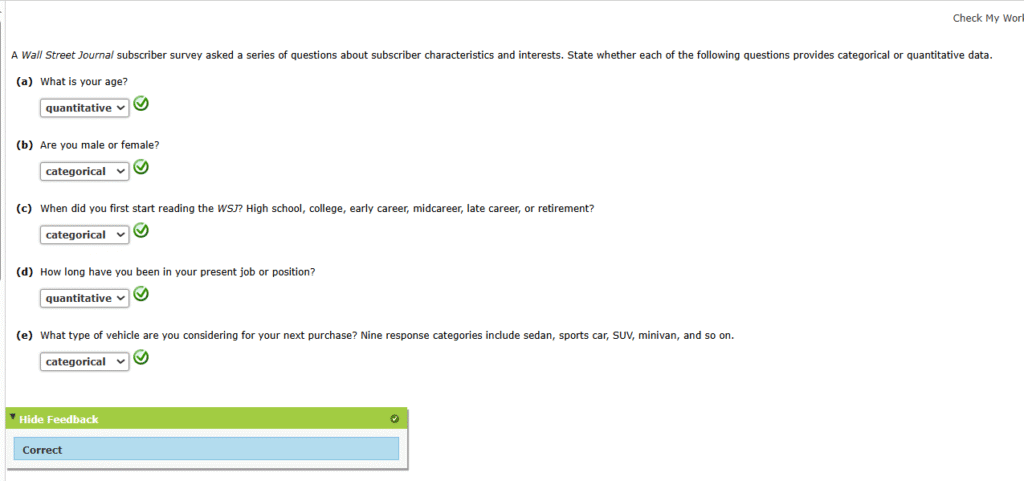
3. A Wall Street Journal subscriber survey asked a series of questions about subscriber characteristics and interests. State whether each of the following questions provides categorical or quantitative data.
4. The following chart is based on data which are percentages of respondents to a survey who listed various factors as most important when making a job decision.

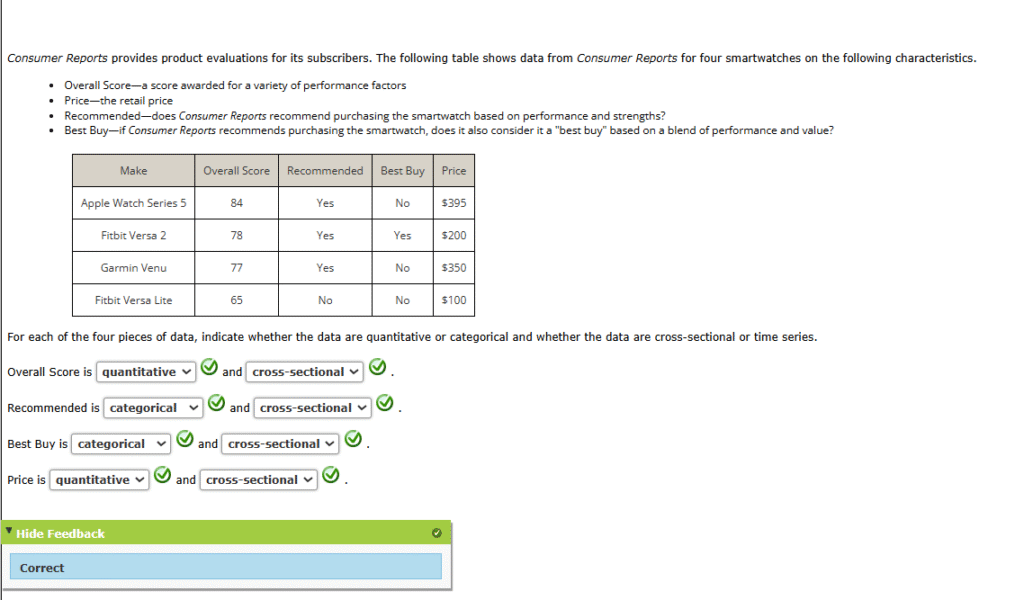
5. Consumer Reports provides product evaluations for its subscribers. The following table shows data from Consumer Reports for four smartwatches on the following characteristics.
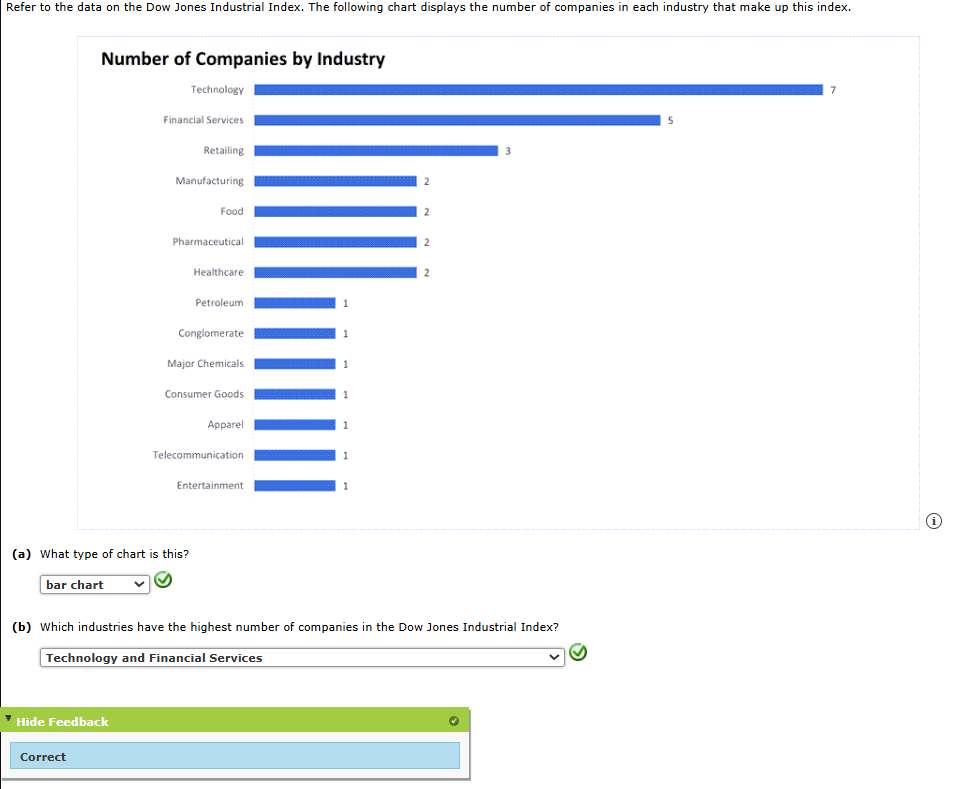
6. Refer to the data on the Dow Jones Industrial Index. The following chart displays the number of companies in each industry that make up this index.
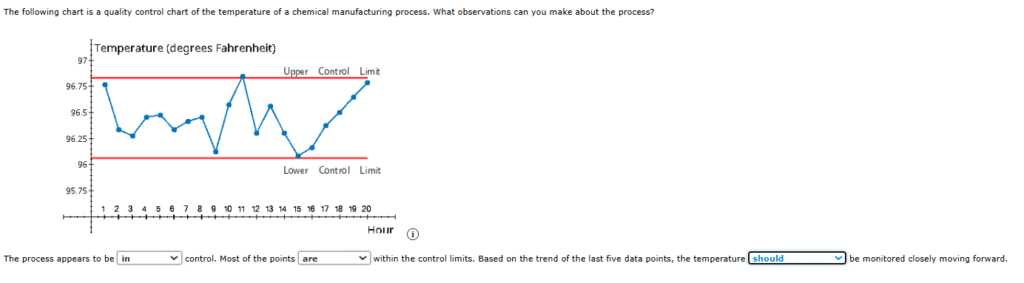
7. The following chart is a quality control chart of the temperature of a chemical manufacturing process. What observations can you make about the process?
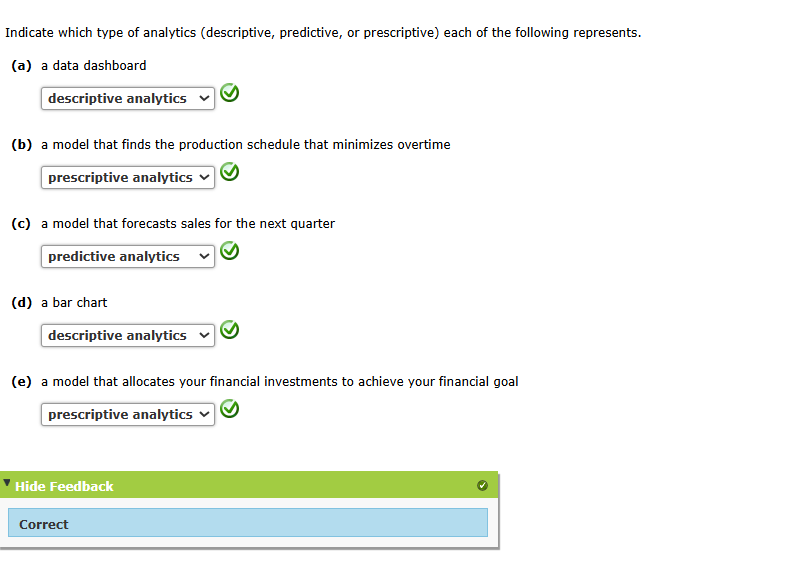
8. Indicate which type of analytics (descriptive, predictive, or prescriptive) each of the following represents.
9.The recruiting process for a full-time master’s program in data science consists of the following steps. The program director obtains e-mail addresses of undergraduate seniors who have taken the Graduate Record Exam (GRE) and expressed an interest in data science. An e-mail inviting the students to an online information session is sent. At the information session, faculty discuss the program and answer questions. Students apply through a web portal. An admissions committee makes an offer of admission (or not) along with any financial aid. If the person is admitted, the person either accepts or rejects the offer. Consider the following chart.

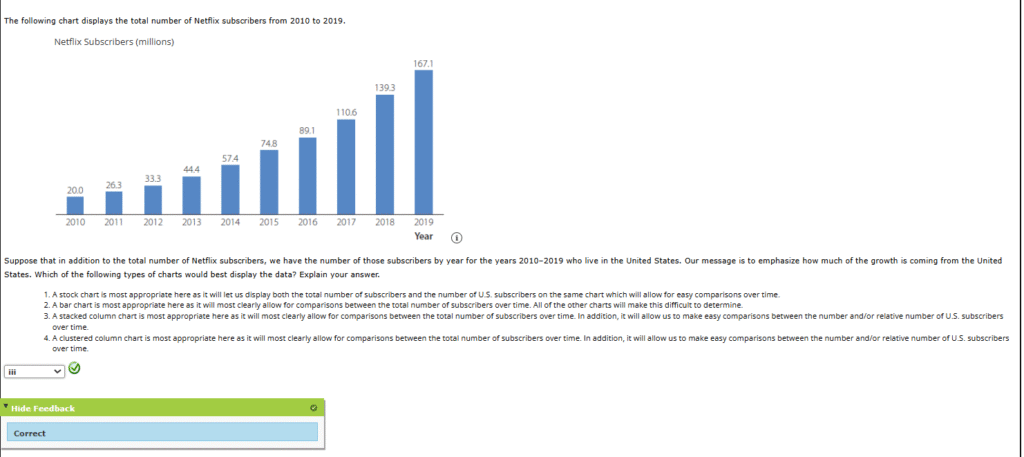
10.The following chart displays the total number of Netflix subscribers from 2010 to 2019.
11. A newspaper reported the results of a survey of data scientists. The survey asked the data scientists how they spend their time. The following chart shows the percentage of respondents who answered four hours or less per week or at least five hours per week for the amount of time they spend on exploring data and on presenting analyses.

12. Suppose we want to better understand the relationship between house price and square footage of the house, and we have collected the house price and square footage for 75 houses in a particular neighborhood of Cincinnati, Ohio, from the Zillow website on January 3, 2021.

13. The following chart displays the total number of Netflix subscribers from 2010 to 2019.

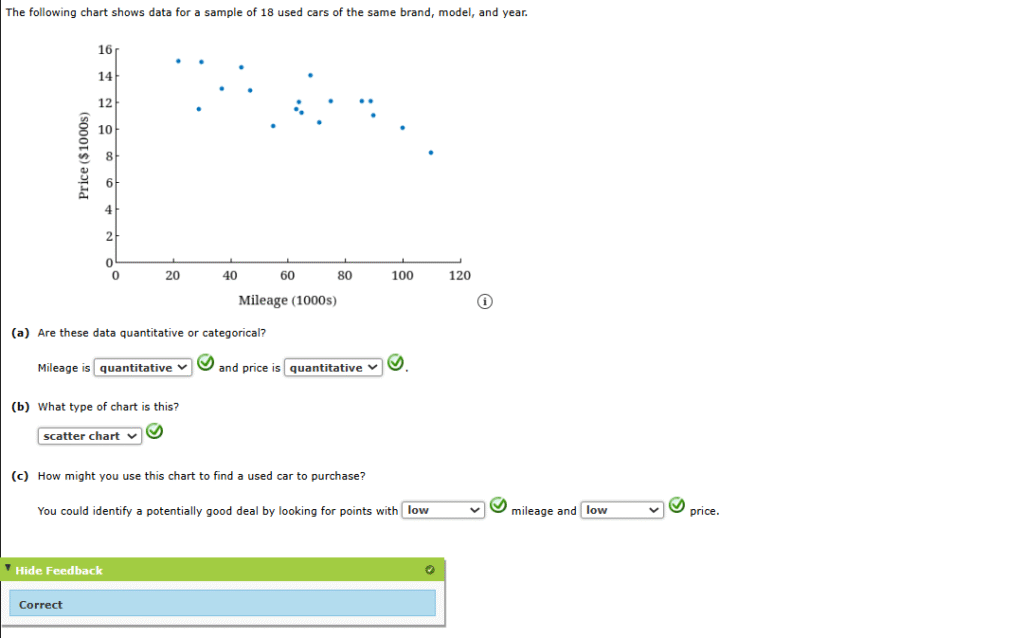
14. The following chart shows data for a sample of 18 used cars of the same brand, model, and year.
15. The following high-low-close stock chart gives the stock price for Exxon Mobile Corporation over a 12-month period. The data are the low, high, and closing price per share on the first trading day of the month.
