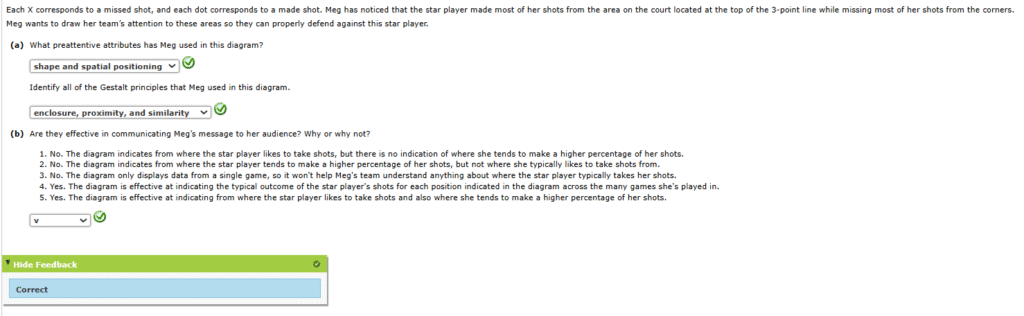
1.Meg Lawson is an assistant coach for a high school basketball team. Meg has prepared a scouting report on her team’s upcoming opponent, which is led by a star player who prefers to shoot from near the 3-point line. Meg has created the below diagram to show this star player’s shot selection from a recent game.

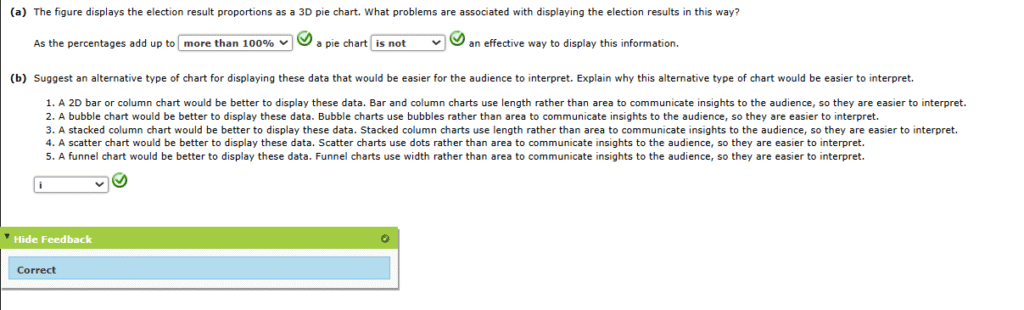
2. Approval voting is a type of voting system in which voters can vote for any number of eligible candidates. A vote for a candidate in this type of system indicates that the voter “approves” of that candidate for the position the candidate is seeking. In the final tally of the election results, the total number of approval results for each candidate is calculated. The candidate who receives the most approval votes is declared the winner. The figure below displays the results from an approval voting election in which there were four eligible candidates: C. Sittenfeld, R. Manley, S. Keskin, and K. Nowak. A total of 1,218 voters participated in this election. The table below shows the number of votes received by each candidate as well as the proportion of voters who approved of each candidate.
| Candidate | Number of Votes Received | Proportion of Voters Who Approve of This Candidate |
|---|---|---|
| C. Sittenfeld | 482 | 39.6% |
| A. Marshall | 689 | 56.6% |
| S. Keskin | 354 | 29.1% |
| K. Nowak | 514 | 42.2% |

3. Which of the following types of memory is used to process preattentive attributes?
A. Iconic Memory
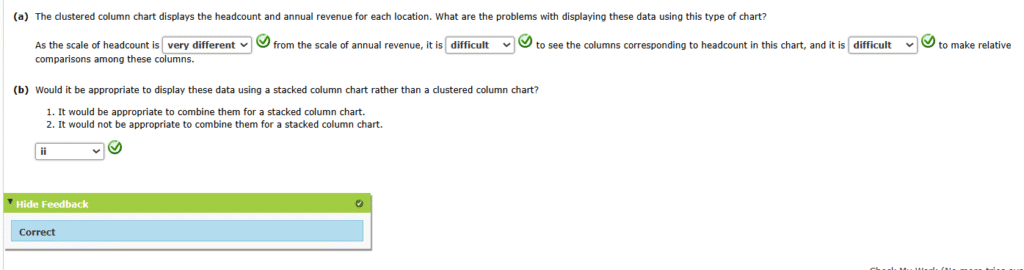
4. BeFit Gyms operates four exercise gyms in the state of Michigan. The gyms are located in Saline, Tecumseh, Dexter, and Jackson. The gyms are different sizes, and they require different headcounts of staff to operate. The table below displays the headcount (in full-time equivalent, FTE) and annual profit (in $1,000s) for each of the four locations.
| Gym Location | Headcount (FTE) | Annual Revenue ($1,000s) |
|---|---|---|
| Saline | 18 | 787 |
| Tecumseh | 11 | 674 |
| Dexter | 9 | 784 |
| Jackson | 12 | 642 |

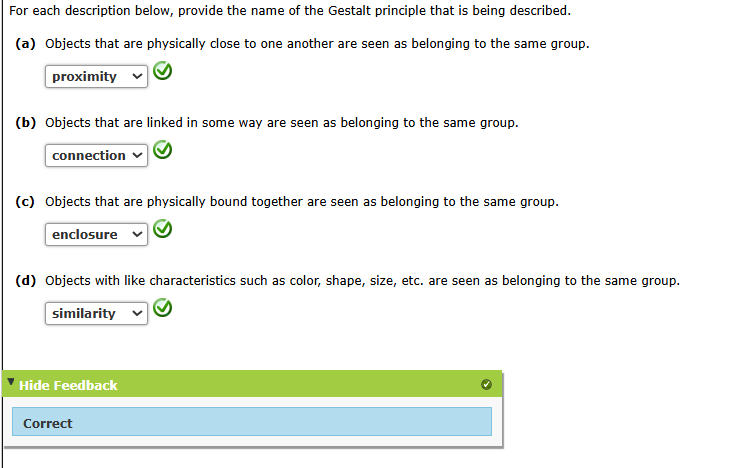
5. For each description below, provide the name of the Gestalt principle that is being described.
6. The following chart displays data related to the student enrollment at several schools located in the Philadelphia City School District.

7. The following scatter chart shows the relationship between the percentage of college graduates and the median monthly rent in different sub-boroughs (a description of an area within the city) of New York City. Each point in the scatter chart represents a different sub-borough in New York City.

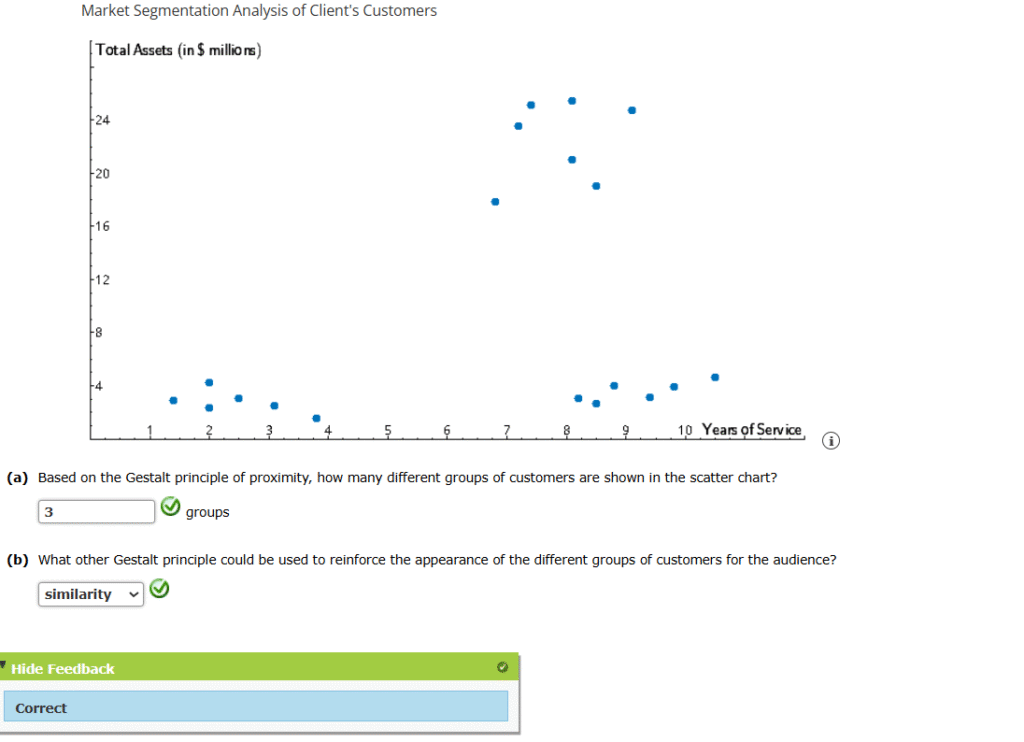
8. A certain company provides marketing analytics consulting for clients. For one of its clients, the company has been asked to perform a market segmentation study for a business client that provides auditing services to manufacturing customers. The client believes there are two variables of importance that should be used to group similar customers into clusters: Years of Service with the Client and Total Assets. The company plans to use a clustering algorithm to group similar customers into different clusters, but before applying the algorithm, the company creates a simple scatter chart to plot each customer based on their Years of Service with the Client and Total Assets. The scatter chart created by the company follows.
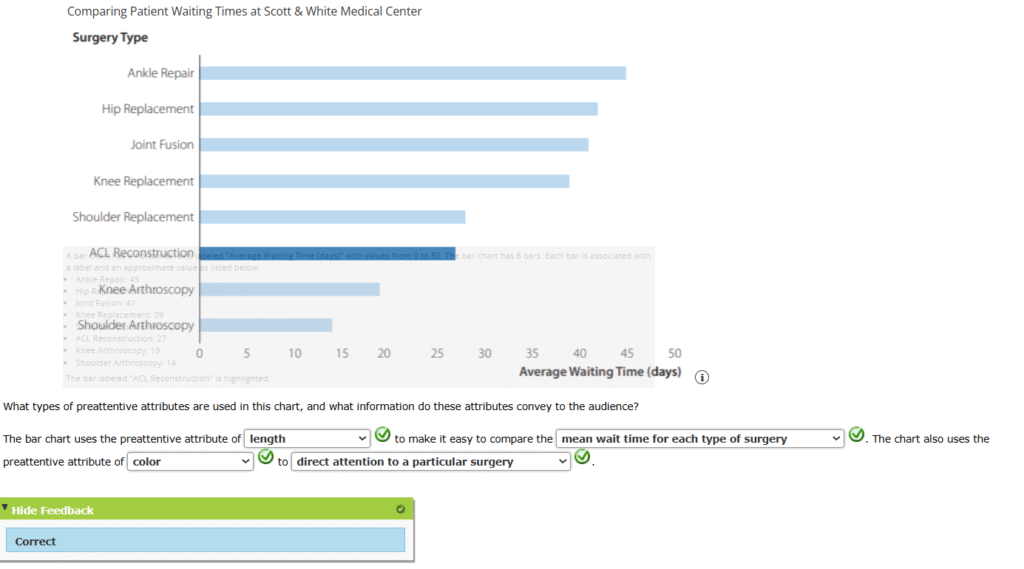
9. The Scott & White Medical Center in Temple, Texas, is examining the mean waiting time for patients to receive common orthopedic surgeries at its facility. The medical administrators have collected data on patient waiting times. The mean patient waiting times (in days) for different orthopedic surgeries are shown in the chart below. The medical center is particularly interested in the wait times for anterior cruciate ligament (ACL) reconstruction surgeries because ACL reconstructions are the most common type of orthopedic surgery performed at its facility.
10. A manufacturing firm would like to compare its monthly revenues and costs for the previous year. The following table shows the revenues and costs for the company in each month of the previous year. Of particular interest to the company is how the company’s revenues and costs perform during the summer months because that is when the company’s sales tend to be highest.
| Month | Revenues (in $1,000s) | Costs (in $1,000s) |
|---|---|---|
| Jan | 1,121 | 1,007 |
| Feb | 997 | 1,002 |
| Mar | 1,151 | 1,010 |
| Apr | 1,202 | 1,085 |
| May | 1,422 | 1,287 |
| Jun | 1,877 | 1,488 |
| Jul | 1,911 | 1,621 |
| Aug | 1,988 | 1,625 |
| Sep | 1,521 | 1,617 |
| Oct | 1,288 | 1,178 |
| Nov | 1,100 | 1,008 |
| Dec | 1,022 | 987 |


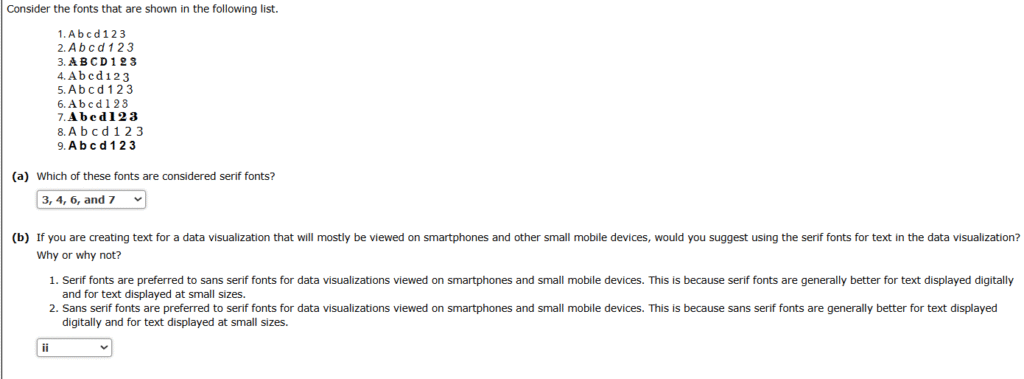
11. Consider the fonts that are shown in the following list.
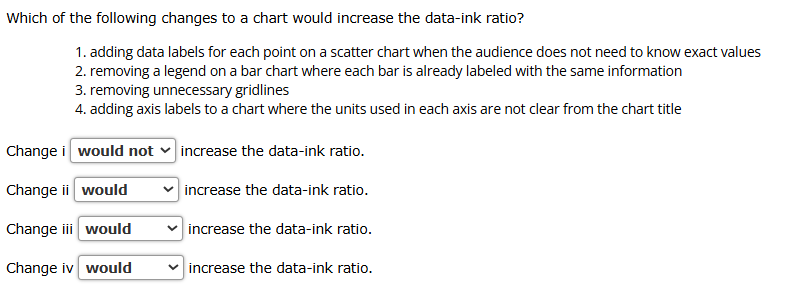
12. Which of the following changes to a chart would increase the data-ink ratio?
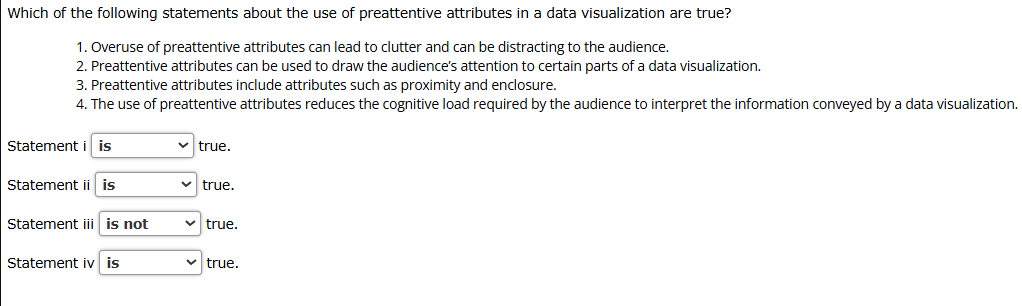
13. Which of the following statements about the use of preattentive attributes in a data visualization are true?
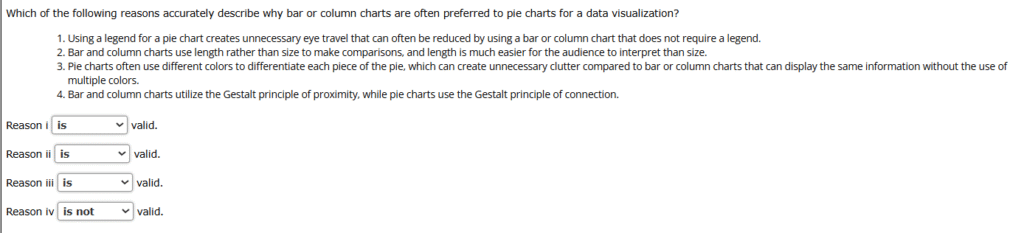
14. Which of the following reasons accurately describe why bar or column charts are often preferred to pie charts for a data visualization?
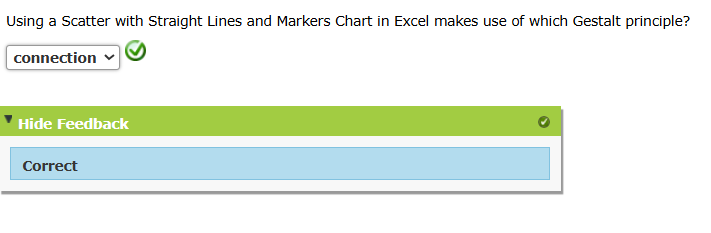
15. Using a Scatter with Straight Lines and Markers Chart in Excel makes use of which Gestalt principle?
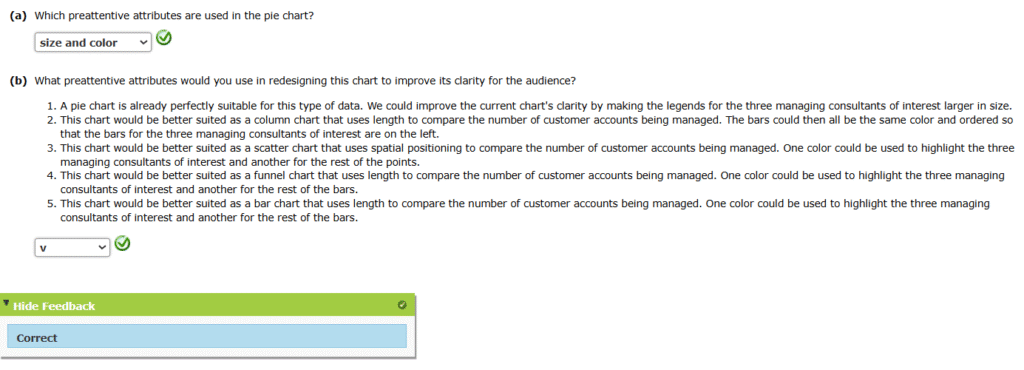
16. Platt Consulting Services is interested in comparing the number of customer accounts managed by its managing consultants. In particular, the company needs to compare the number of accounts managed by Bernie Smith, Stanley Lucas, and Gracie Rogers because these three accountants started with the company at approximately the same time and have similar skills. The chart below is a default chart produced in Excel.

Number of Customer Accounts Managed
A pie chart has 9 pieces, each a different color. The piece’s labels are given in a legend below the chart. Each piece’s label and approximate percentage of the overall circle are as follows.
Kendall Espinosa: 24%
Norma Lane: 2%
Caroline Hyde: 3%
Margaret Walnut: 5%
Michael Withrow: 7%
Hurley Reyes: 9%
Stanley Lucas: 15%
Gracie Rogers: 16%
Bernie Smith: 18%