
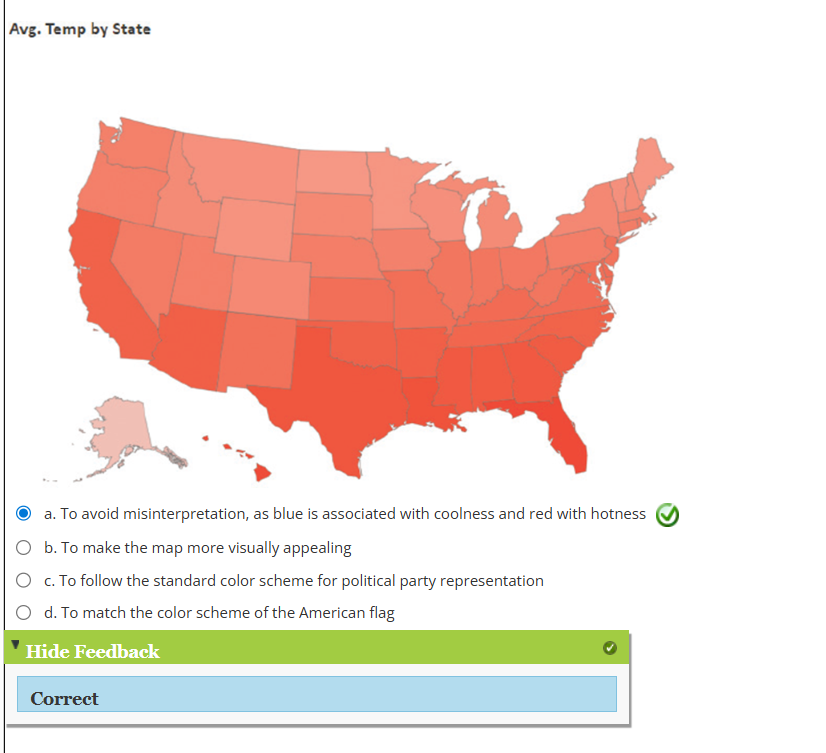
1.Why was the color scheme changed from blue to red in the below Power BI example using sequential color?
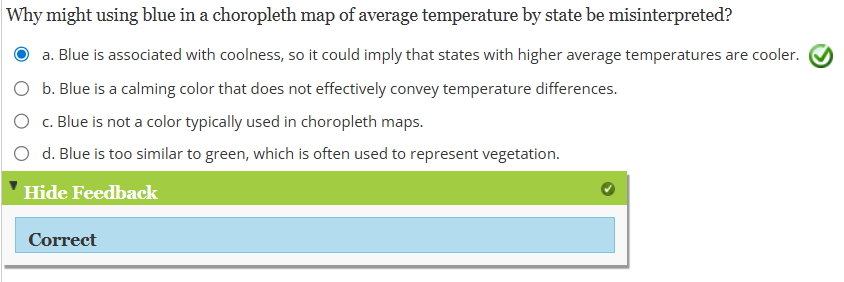
2. Why might using blue in a choropleth map of average temperature by state be misinterpreted?
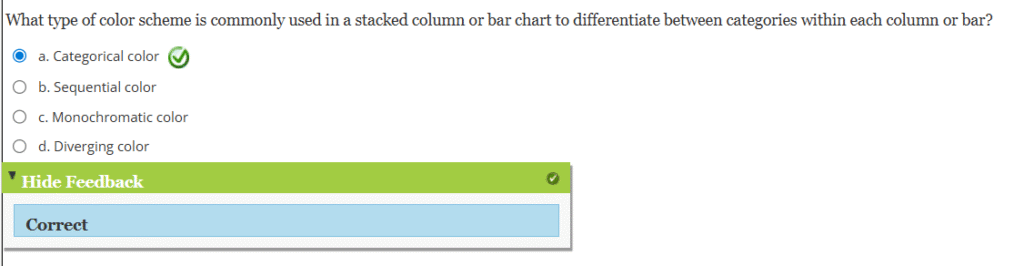
3. What type of color scheme is commonly used in a stacked column or bar chart to differentiate between categories within each column or bar?
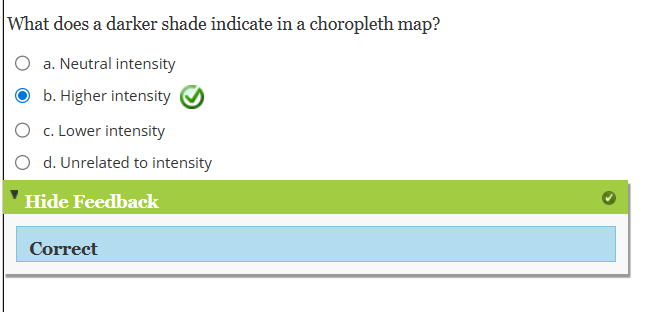
4. What does a darker shade indicate in a choropleth map?
5. What type of color scheme is used to emphasize values above and below a central point?
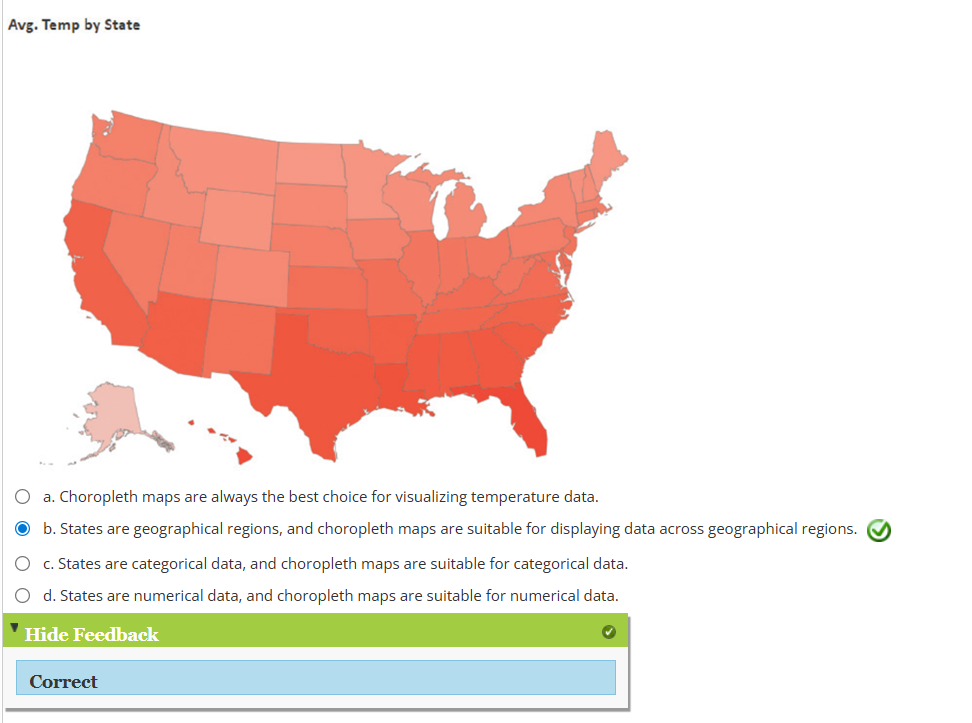
6. In the below Power BI example using sequential color, why is a choropleth map an appropriate choice for visualizing average annual temperature by state?
7. In the United States, which color is most often used to indicate coolness?
