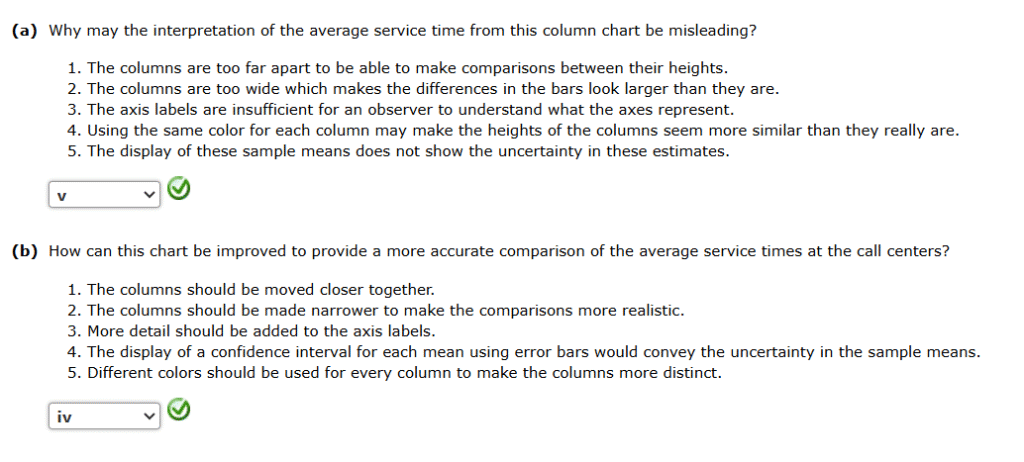
1. Skylar Diggins is reviewing the performance of four call centers under her management. Twelve observations of the amount of time it took to process refund requests have been collected from each of the four call centers. Based on these observations, the following column chart displays the average service time of each call center.
A.

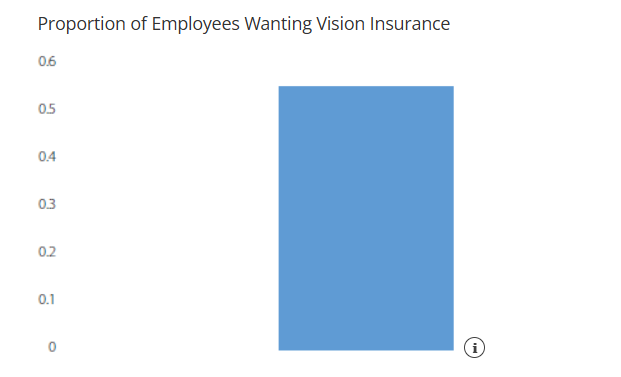
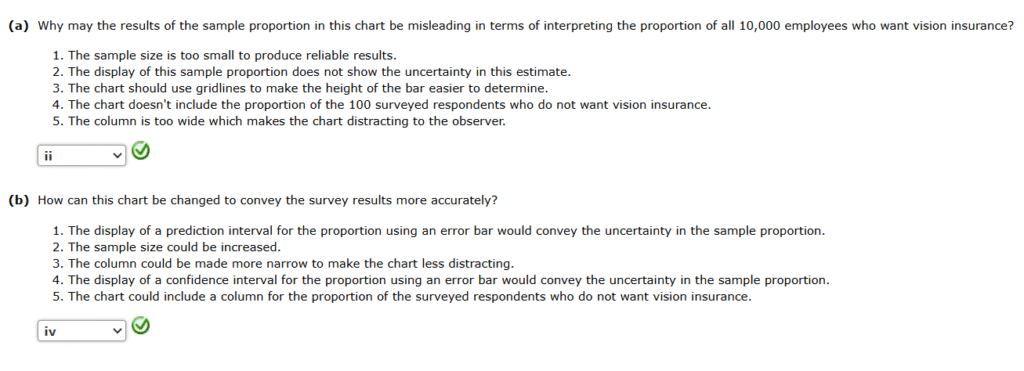
2. Before including vision insurance in the benefits package for its 10,000 employees, Valmont Industries wants to confirm that it is desired by a majority of employees. Valmont has taken an employee survey and out of the 100 survey respondents, 55 employees said they would opt into the coverage. An analyst has displayed the results in the following column chart.
A.
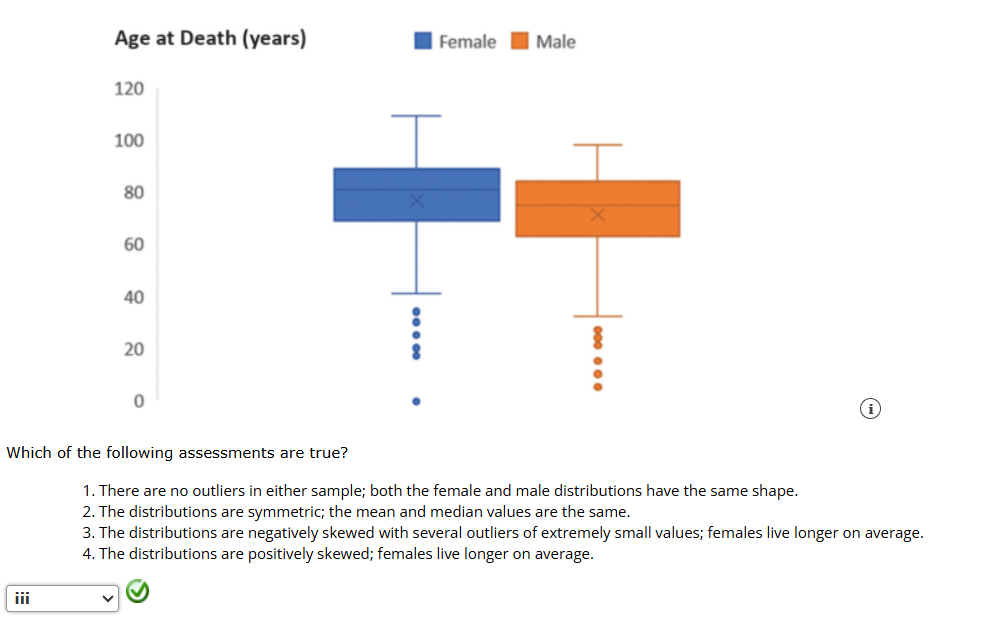
3. Josh Bell, an actuarial scientist for Yolo Life Insurance, has created the following box and whisker charts of the age at death for a randomly drawn sample representative of potential clients.
A.
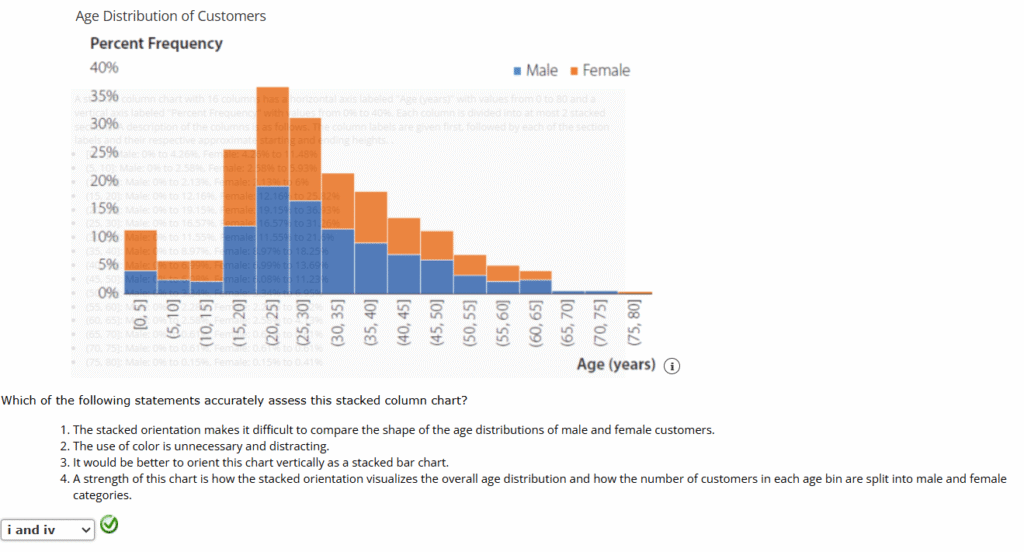
4. Based on a survey of 1,046 individuals who recently took a boat cruise on Lake Havasu, Rochambeau Boating is analyzing the demographics of its customers. It is believed that the sample (388 female customers and 658 male customers) is representative of Rochambeau’s overall customer population. An analyst has created the following chart depicting the age and sex distribution of the survey respondents.
A.
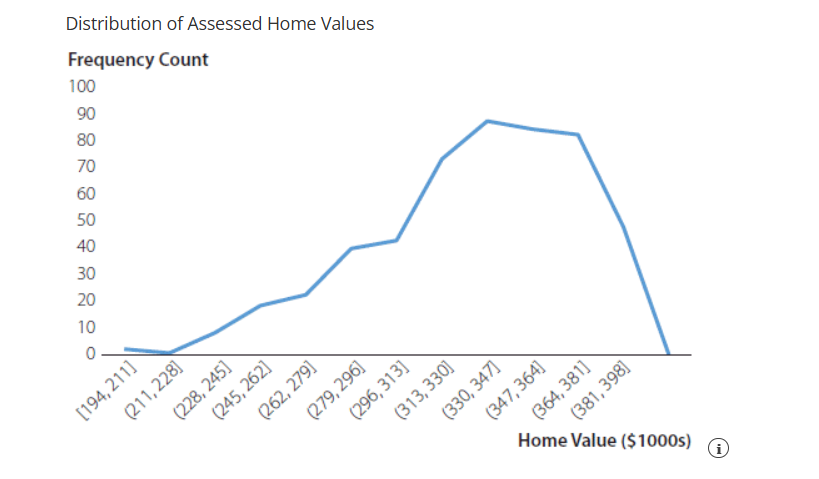
5. Abbie Aburizek, a realtor at Alamo Acres, is conducting research on assessed home values in a local suburb. Abbie has constructed the following frequency polygon.
A.
6. A foodie blog has gathered data on the delivery times for four various restaurant delivery services (CHOMP, Uber Eats, DoorDash, GrubHub). Blog editor Auguste Gusteau has been analyzing the distribution of delivery times for each of these delivery companies and is contemplating how to visually compare the four delivery time distributions. Which of the following would you recommend?
A.

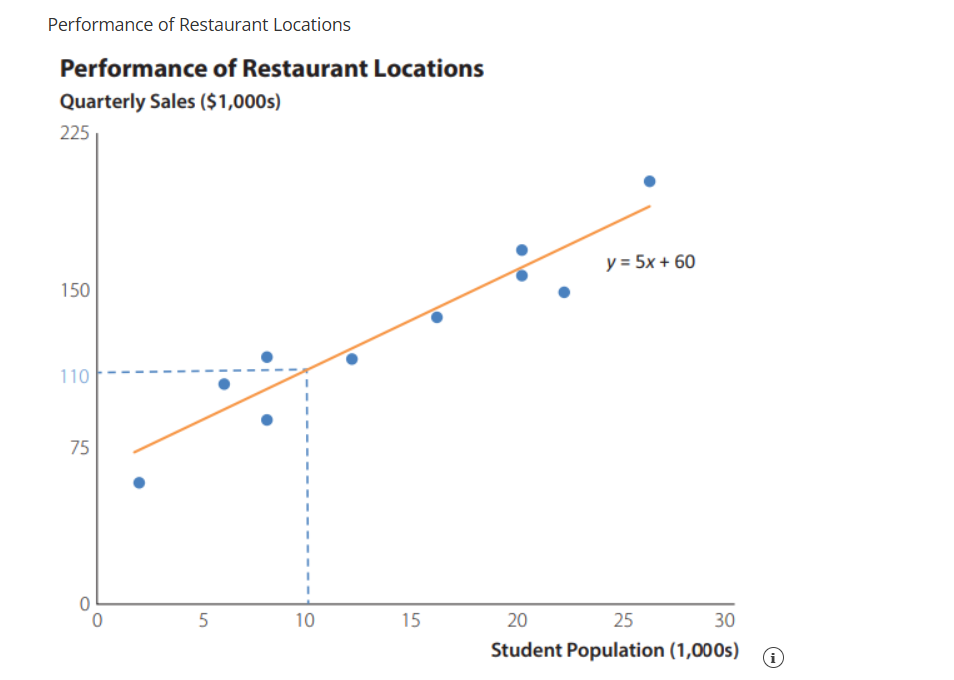
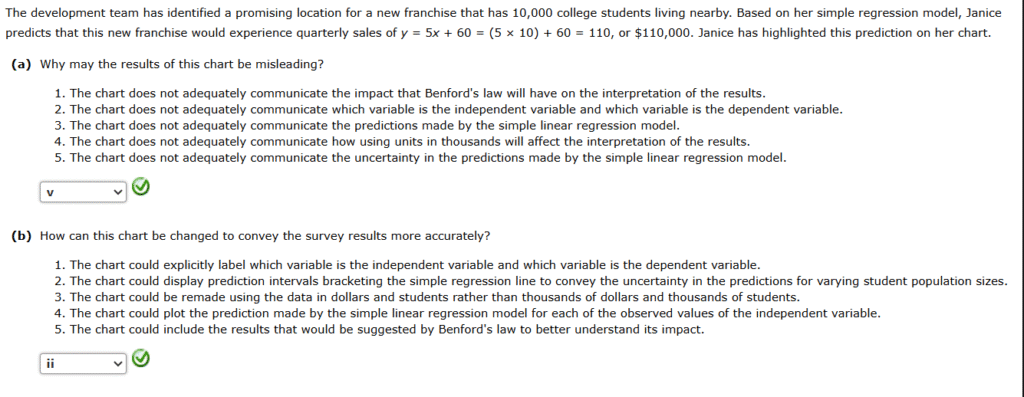
7. A restaurant chain particularly popular with college students has collected data on the relationship between the quarterly sales of existing restaurants and the size of the college student population in the respective restaurant’s immediate region. Janice Moore, director of franchising, has constructed a simple linear regression model using quarterly sales as the dependent variable (y) and college student population as the independent variable (x). The data and simple linear regression model are displayed in the chart below.
A.
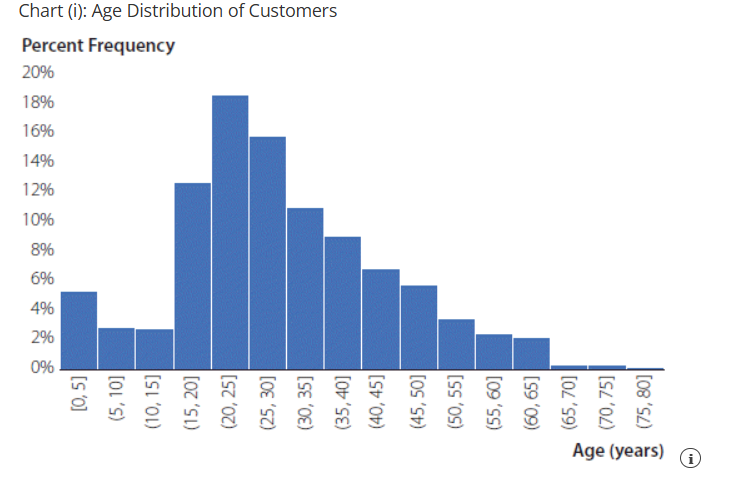
8. Based on a survey of 1,046 individuals who recently took a boat cruise on Lake Havasu, Rochambeau Boating is analyzing the percent frequency distribution of its customers’ ages. An analyst has created four histograms by varying the bin size. Rochambeau seeks a visualization of the customer age distribution that captures general trends in the data but does not blur patterns by grouping customers with disparate ages (and therefore behaviors) into the same bins.
A.


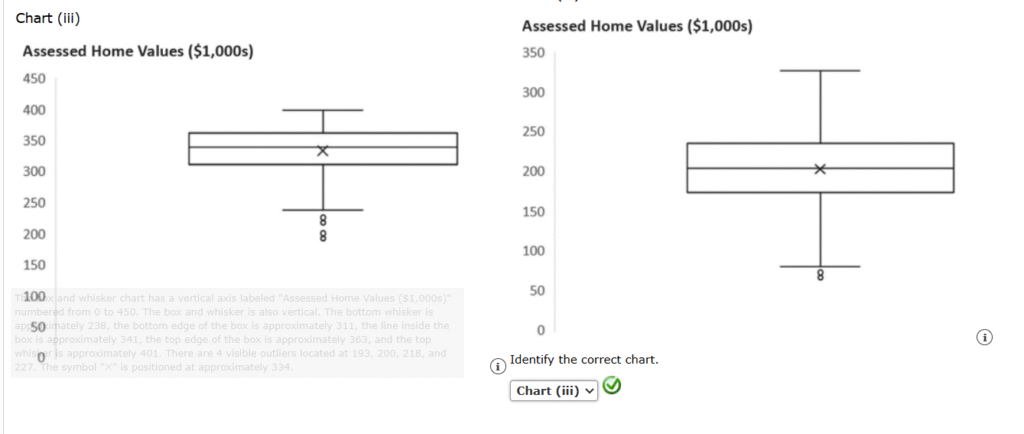
9. Chris Fultz, a realtor at Betelgeuse Realty, is conducting research on assessed home values in a local suburb. Chris has constructed the following histogram.
A.

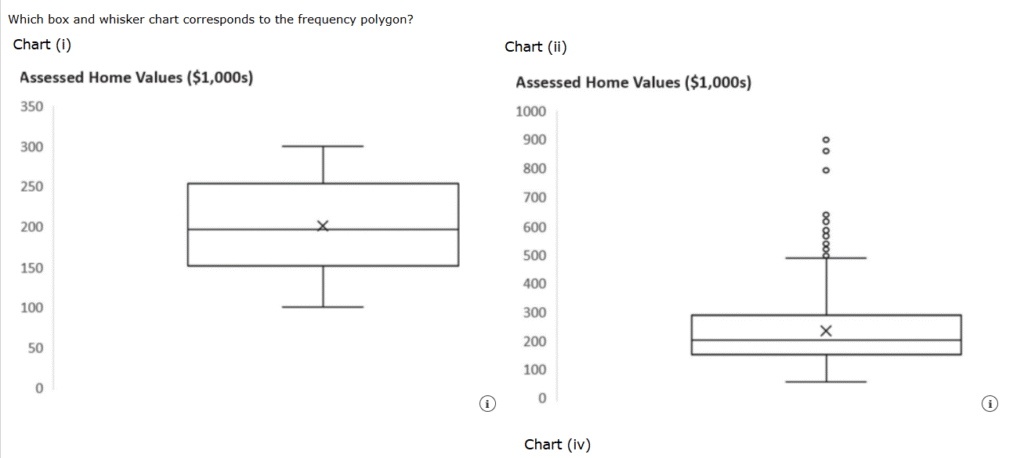
Which box and whisker chart corresponds to the histogram?


Identify the correct chart.

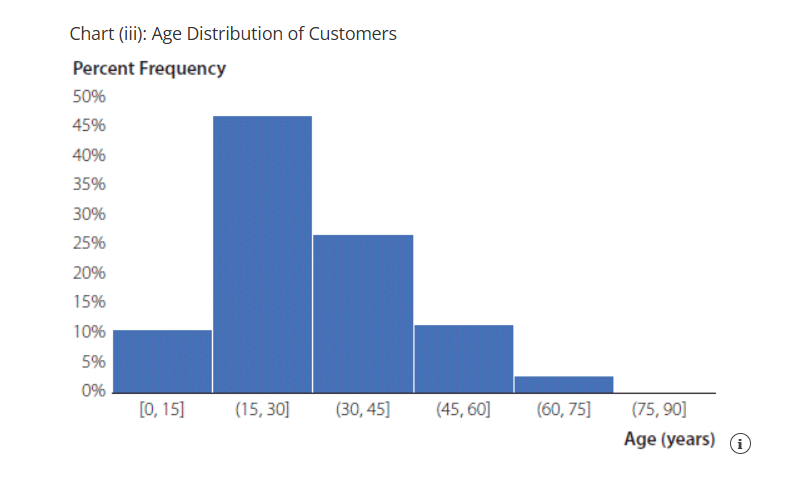
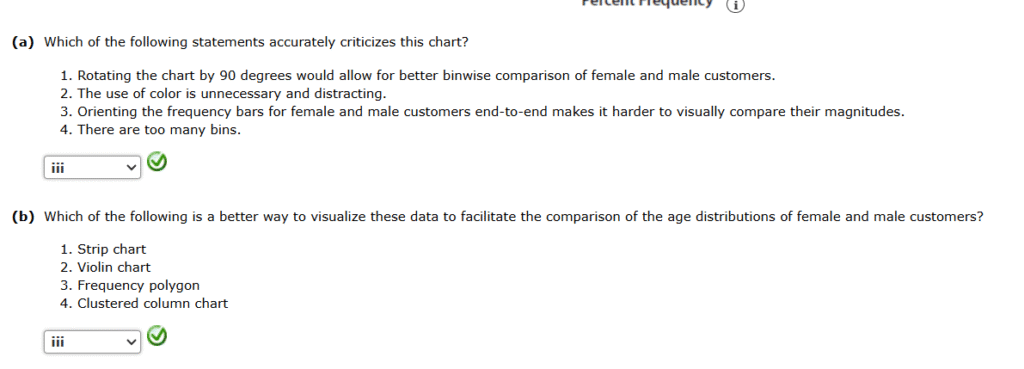
10.Based on a survey of 1,046 individuals who recently took a boat cruise on Lake Havasu, Rochambeau Boating is analyzing the demographics of its customers. Treating the sample of 388 female customers and 658 male customers separately, an analyst is interested in comparing how the ages of the female customers are distributed as a percentage of the 388 female customers surveyed, and how the ages of the male customers are distributed as a percentage of the 658 male customers surveyed. An analyst has created the following chart depicting the age and sex distribution of the survey respondents.
A.

11. Based on a survey of 1,046 individuals who recently took a boat cruise on Lake Havasu, Rochambeau Boating is analyzing the demographics of its customers. It is believed that the sample (388 female customers and 658 male customers) is representative of Rochambeau’s overall customer population. An analyst has created the following chart depicting the age and sex distribution of the survey respondents.
A.

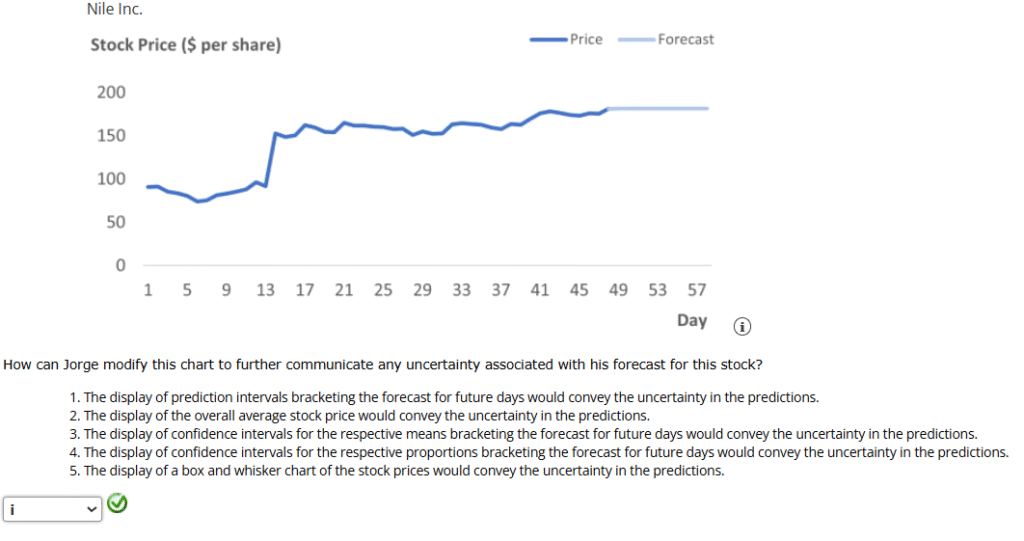
12. To inform his day trading, Jorge Belfort has gathered historical stock price data on Nile Inc., a green energy company he has been researching. Jorge has constructed the following time series chart to display the stock prices as well as his forecasts of the stock price over the next few days.
A.
13. Aspiring meteorologist Jesse Kosch has collected data on the daily high temperature in Valentine, Nebraska, over an entire year. Jesse then used a strip chart to display each day’s high temperature by month.
A.

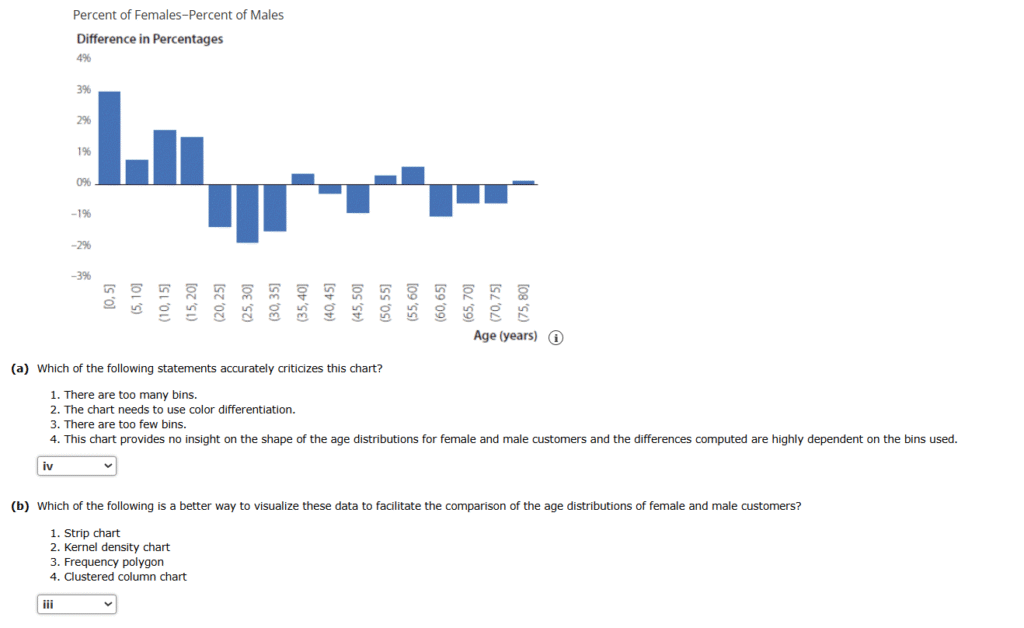
14. Based on a survey of 1,046 individuals who recently took a boat cruise on Lake Havasu, Rochambeau Boating is analyzing the demographics of its customers. Treating the sample of 388 female customers and 658 male customers separately, an analyst is interested in comparing how the ages of the female customers are distributed as a percentage of the 388 female customers surveyed, and how the ages of the male customers are distributed as a percentage of the 658 male customers surveyed. An analyst has created the following chart computing the difference in these percentages for each age bin.
A.