

Ch. 1 Homework
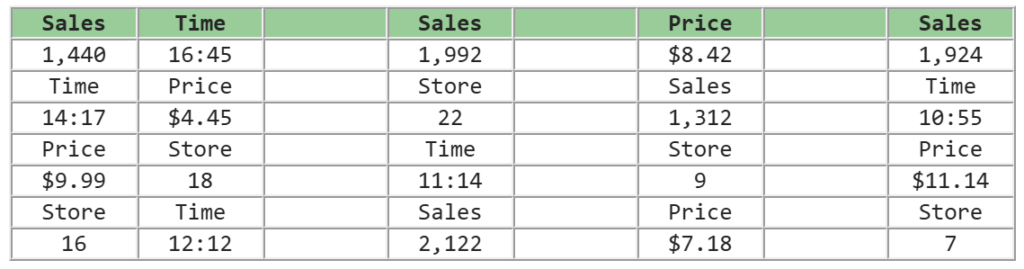
1. Classify the following datasets as structured or unstructured.
a. Jerome: Age(65), Height(65in), Location(Ukraine); Eloise: Age(80), Height(70in), Location(Mali); Luis: Age(83), Height(70in), Location(Nicaragua); Estelle: Age(52), Height(75in), Location(Gambia)multiple choice 1
- Unstructured
- Structured Correct
b. Texts: “It’s cold today,” “Hello?,” “Where are you?”; Date: 1/20/2017, 2/1/2017, 2/9/2017; Price: $0.84, $0.88, $0.10multiple choice 2
- Structured
- Unstructured Correct
c.
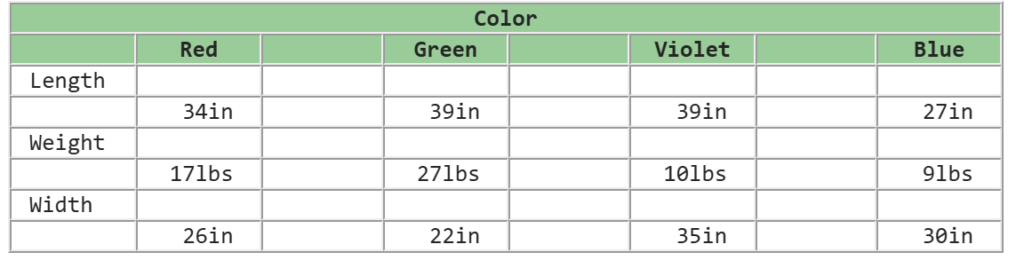
- Structured Correct
d.
multiple choice 4
- Unstructured Correct
2. Which of the following accurately explains the difference between lead and lag information?
Lead information pertains to what will happen and lag information pertains to what did happen. Correct
3. Properly load the following data into the table below.
Score(47), Year(2015), Vote(Yes), Name(Laurene Horton); Score(83), Year(2015), Vote(No), Name(Wilson Zimmerman); Score(35), Year(2016), Vote(No), Name(Jeffrey Wade); Score(48), Year(2016), Vote(No), Name(Kayla Snyder); Score(26), Year(2015), Vote(No), Name(Kayla Snyder); Score(26), Year(2015), Vote(No), Name(Jeffrey Wade); Score(91), Year(2015), Vote(Yes), Name(Candice Graves); Score(62), Year(2016), Vote(Yes), Name(Candice Graves); Score(52), Year(2015), Vote(Yes), Name(Kayla Snyder); Score(83), Year(2016), Vote(No), Name(Laurene Horton);Score(76), Year(2016), Vote(No), Name(Wilson Zimmerman)
Instructions: Enter your responses in the appropriate field in the table below.
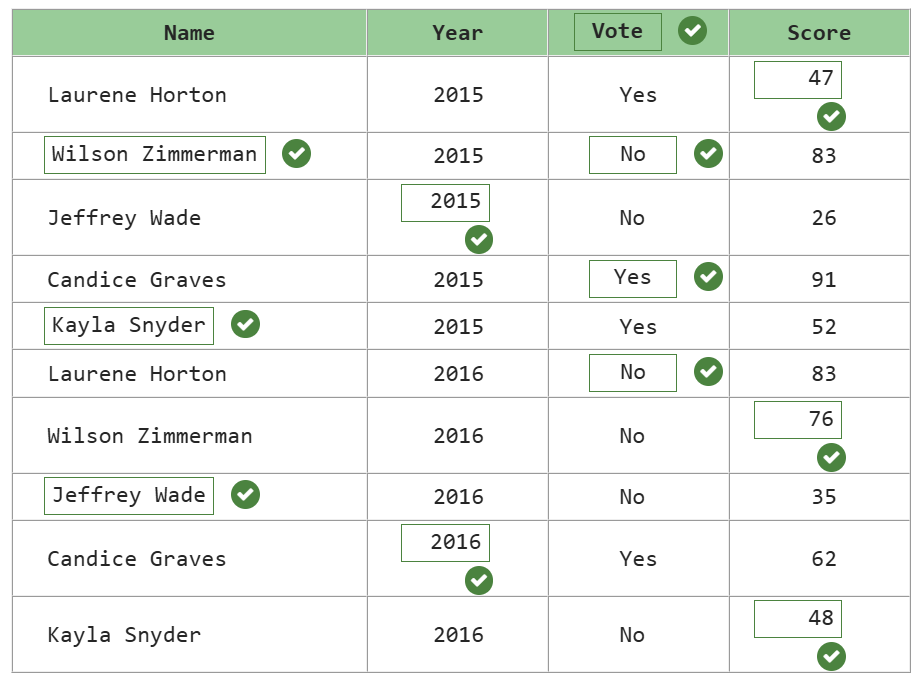
What is the unit of observation?multiple choice 1
Person-year Correct
What is the data type?multiple choice 2
Panel Correct
4. Why is the application of predictive analytics an ideal complement to the formulation of business strategy?
It allows the decision-maker to make evidence-based assessments of expected outcomes from alternative strategies, and then choose the optimal one based on her business objective. Correct
5. Characterize the following predictions as passive or active prediction.
a. Tom predicts his body weight next month after changing to a whole-grains-only diet this month.
Active prediction
b. Ann predicts sales for her product next week based on the number of visits to her website in the past five days.
Passive prediction Correct
c. Laura predicts Twitter traffic for her company over the next 10 days after launching a new advertising campaign last week.
Active prediction Correct
d. Alex predicts total revenues at Macy’s next month using information on Macy’s credit card purchasing last week.
Passive prediction
e. John predicts the winner of a local election based on answers to a recent survey given by local voters.
Passive prediction
6. As a manager at a major insurance company, Meredith asks two of her analysts to help answer two separate questions regarding a recent car insurance client. She asks the first analyst, Darryl, to predict using demographic characteristics (e.g., the client’s age, education, etc.) the likelihood that the client will be in an accident in the next five years. She asks the second analyst, Amanda, to predict the effect of a 10% cut in the client’s premium on the likelihood that the client switches providers in the next three years.
Which analyst(s) is making an active prediction?
Instructions: In order to receive full credit, you must make a selection for each option. For correct answer(s), click the box once to place a check mark. For incorrect answer(s), click the option twice to empty the box.
Amanda
7. Which of the following business questions requires the use of active prediction?
Instructions: In order to receive full credit, you must make a selection for each option. For correct answer(s), click the box once to place a check mark. For incorrect answer(s), click the option twice to empty the box.
How will profits respond to a change in product placement in the store?
Will a new celebrity endorsement enhance sales?
8. Click on the link below to access the dataset Sales and Costs.xlsx answer the following queries.
Instructions: In parts a, b, and e, enter your responses rounded to two decimal places. In parts c–d, enter your responses rounded to the nearest whole number.
a. What are average sales when labor costs exceed $50,000?
$1,481,100.02
b. What are minimum sales when materials costs are less than $20,000?
$504,655.00
c. What region had the highest labor costs? (Enter the region number.)
166
What region had the lowest sales? (Enter the region number.)
223
e. What was the greatest difference in sales across any two regions?
$1,896,659.00
9. A grocery store manager is interested in the data-generating process for her store’s weekly soda sales. She believes factors impacting these sales include price, product placement, and whether the week contains a holiday.
True or False: Following the example in the text, we would use the following expression, Salest = f (Pricet, Placementt, Holidayt, Ut), as a formal representation of the data-generation process for weekly soda sales that incorporates these and additional factors.
False
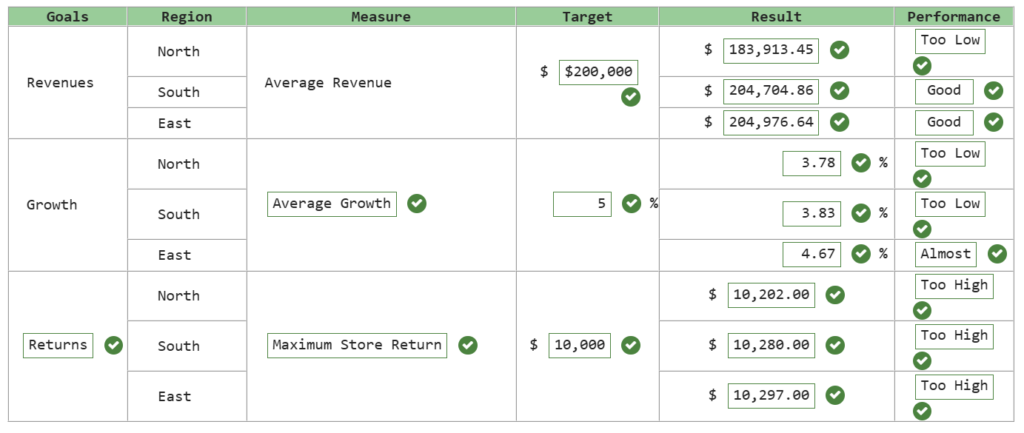
10. Click on the link below to access the dataset Scorecard.xlsx and complete the following scorecard to assess performance on the following objectives.
Instructions: In the “Target” column, enter your responses rounded to the nearest whole number. In the “Result” column, enter your responses rounded to two decimal places.
a. Average regional revenue is at least $200,000.
b. Average regional growth is at least 5%.
c. Returns are no more than $10,000 in any store.
Ch. 4 Homework
1. Explain the difference between the average treatment effect (ATE) and the effect of the treatment on the treated (ETT).
The expected change in the outcome from receiving the treatment for the group of participants actually receiving the treatment is effect of the treatment on the treated (ETT) Correct.
The expected change in the outcome from receiving the treatment for the entire population, regardless of their actual treatment status, is average treatment effect (ATE) Correct.
2. Which of the following is not an element of the scientific method?
Collect market data
Ch. 6 Homework
1. Regarding R-squared:
A. Regarding R-squared:
The fraction of total variation in the dependent variable (Y) that can be attributed to variation in the independent variables (Xs)
b. Why is its magnitude of little relevance when estimating determining functions?
R-squared measures how closely Y moves with the Xs, which captures correlation and not causality. Correct
2. The unconditional correlation between Y and X1 is 0.72, but the semi-partial correlation between Y and X1 controlling for X2 is 0.03. What does this imply about the unconditional correlation between:
a. Y and X2?
They are strongly correlated.
b. X1 and X2?
They are strongly correlated. Correct
3. The unconditional correlation between Y and X1 is 0.74, but the semi-partial correlation between Y and X1 controlling for X2 is 0.07. What does this imply about the unconditional correlation between:
a. Y and X2?
They are strongly correlated
b. X1 and X2?
They are strongly correlated
4. Which of the following assumptions are needed to conclude that the regression estimators are consistent estimates of the parameters of a determining function, beyond those needed to conclude they are consistent estimators of the parameters of a population regression equation?
Instructions: In order to receive full credit, you must make a selection for each option. For correct answer(s), click the box once to place a check mark. For incorrect answer(s), click the option twice to empty the box.
A. There is a data-generating process of the form: Yi = α + β1X1i + … + βKXKi + Ui
B. E [U] ≠ E [U × X1] ≠ … ≠ E [U × XK] ≠ 0
C. The data are a select sample with Yi > 0
D. E [U] = E [U × X1] = … = E [U × XK] = 0
Assumption A
Assumption D
5. A dataset on an outcome (Y) and treatment (X) is collected via an experiment, where the treatment is randomly assigned. If we write the data-generating process for Y as: Yi = α + βXi + Ui, what can we say about the correlation between X and U?
The correlation is zero
6. Click on the link below to access the dataset Ch6Prob111213.xlsx which contains daily information on number of visits to your firm’s website (WebVisits), number of Yahoo visitors who viewed your banner ad (YahooViews), and number of television-watchers who viewed your TV ad (TVViews).
Answer the following questions pertaining to the population regression equation: WebVisits = B + M1YahooViews + M2TVViews.
Instructions: Enter your responses rounded to three decimal places. If you are entering any negative numbers be sure to include a negative sign (-) in front of those numbers.
a. Assume you have a random sample and homoscedasticity. Test the hypothesis that M1 is equal to zero, using a confidence level of 95%.
Reject the null if we believe all our other assumptions. Correct
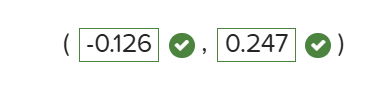
b. Assume you have a random sample and homoscedasticity. Build a 99% confidence interval for M2—the population regression coefficient for TVViews.
7. Suppose you have regressed Y on X, and the results indicate an R-squared of 0.02.
True or False: This regression is unsuitable for making any predictions.
False
8. Suppose you estimate the following regression equation for your firm’s Sales and Advertising Expenditures for a given month across many regions: Sales = 91,043 + 0.08AdExp. You are willing to assume that you have a random sample (from a population of region-months spanning the past year into the subsequent year), and the sample size is at least 60. Given these assumptions and these estimates:
Instructions: Enter your responses rounded to the nearest whole number.
a. Predict the Sales next month if a region is observed to have $100,000 in advertising expenditure.
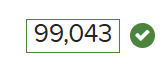
b. If Region A is observed to spend $50,000 more than Region B in advertising expenditure, predict the difference in their sales.

c. How would your answer to Part b change if we instead asked for a prediction for the increase in Region B’s sales if that region increased its advertising expenditure by $50,000?
You would have to make further assumptions to give a figure.